Energy Data With Powershare
The Tesla app provides insight into your home's energy usage. The energy graphs help you understand your energy data over time and maximize the benefits of your renewable energy at home.
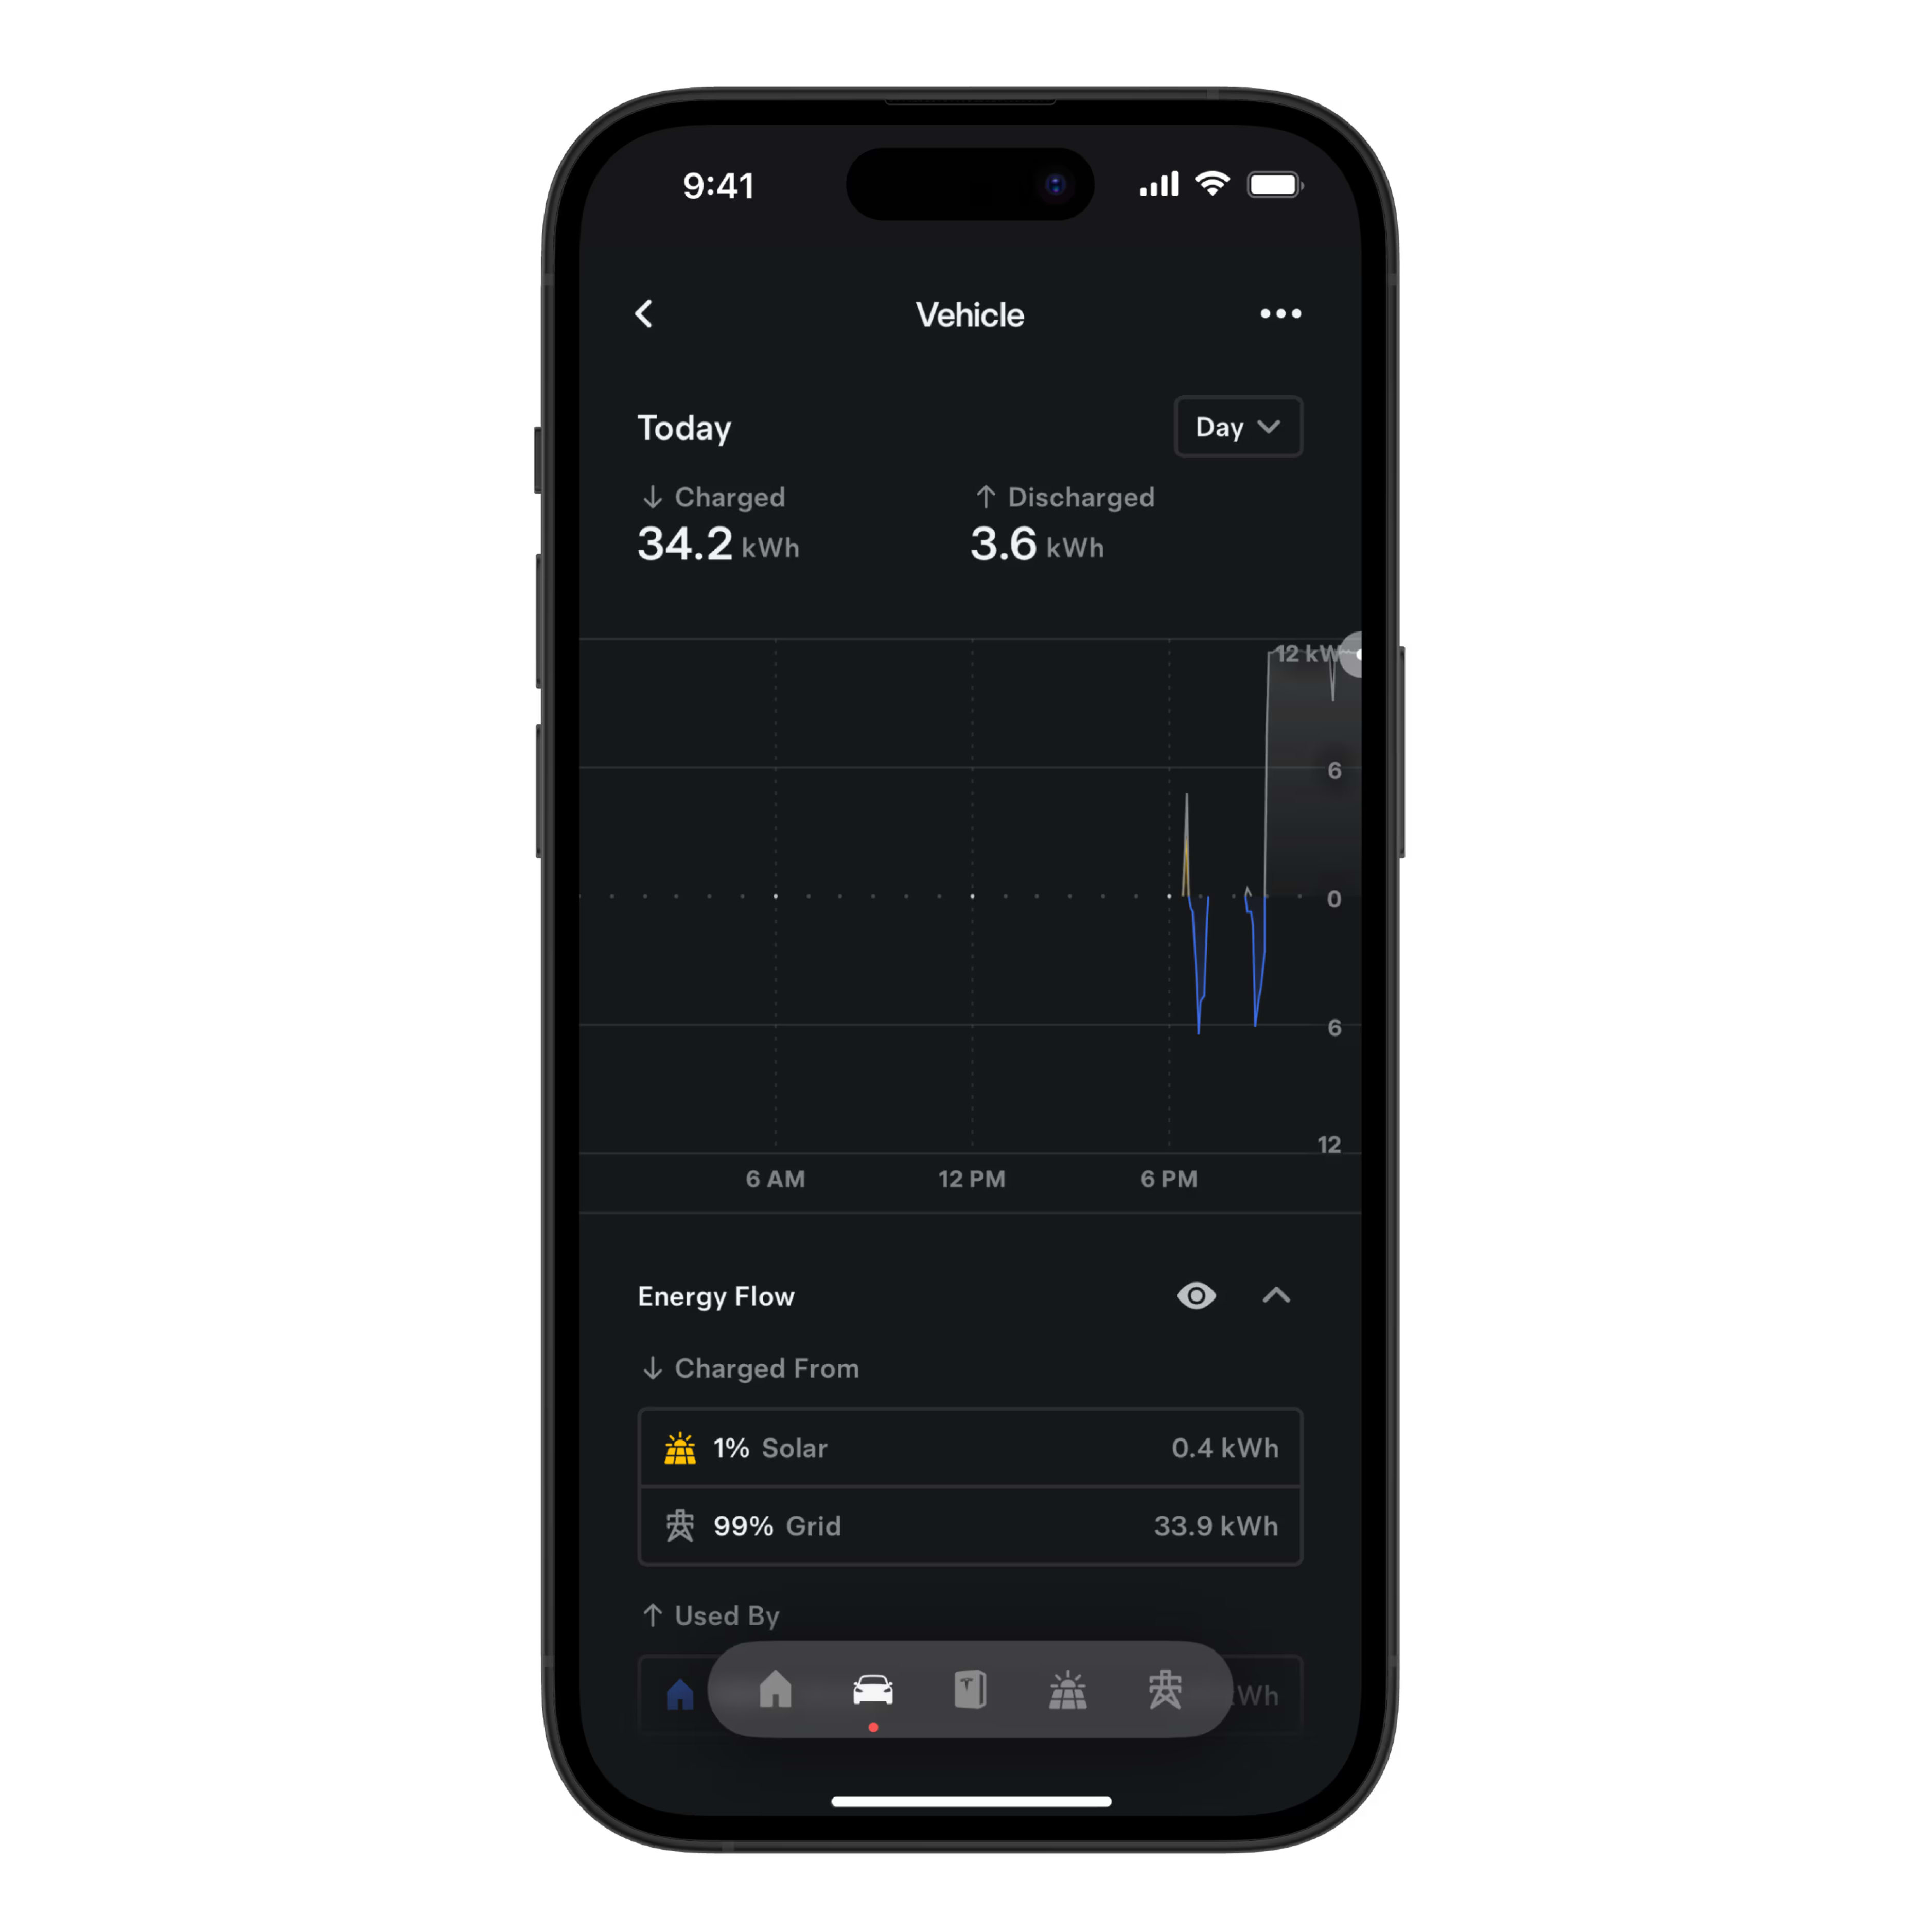
With Powershare, you can also see how much your vehicle is charging from solar or the grid and how much your vehicle is discharging to your home.

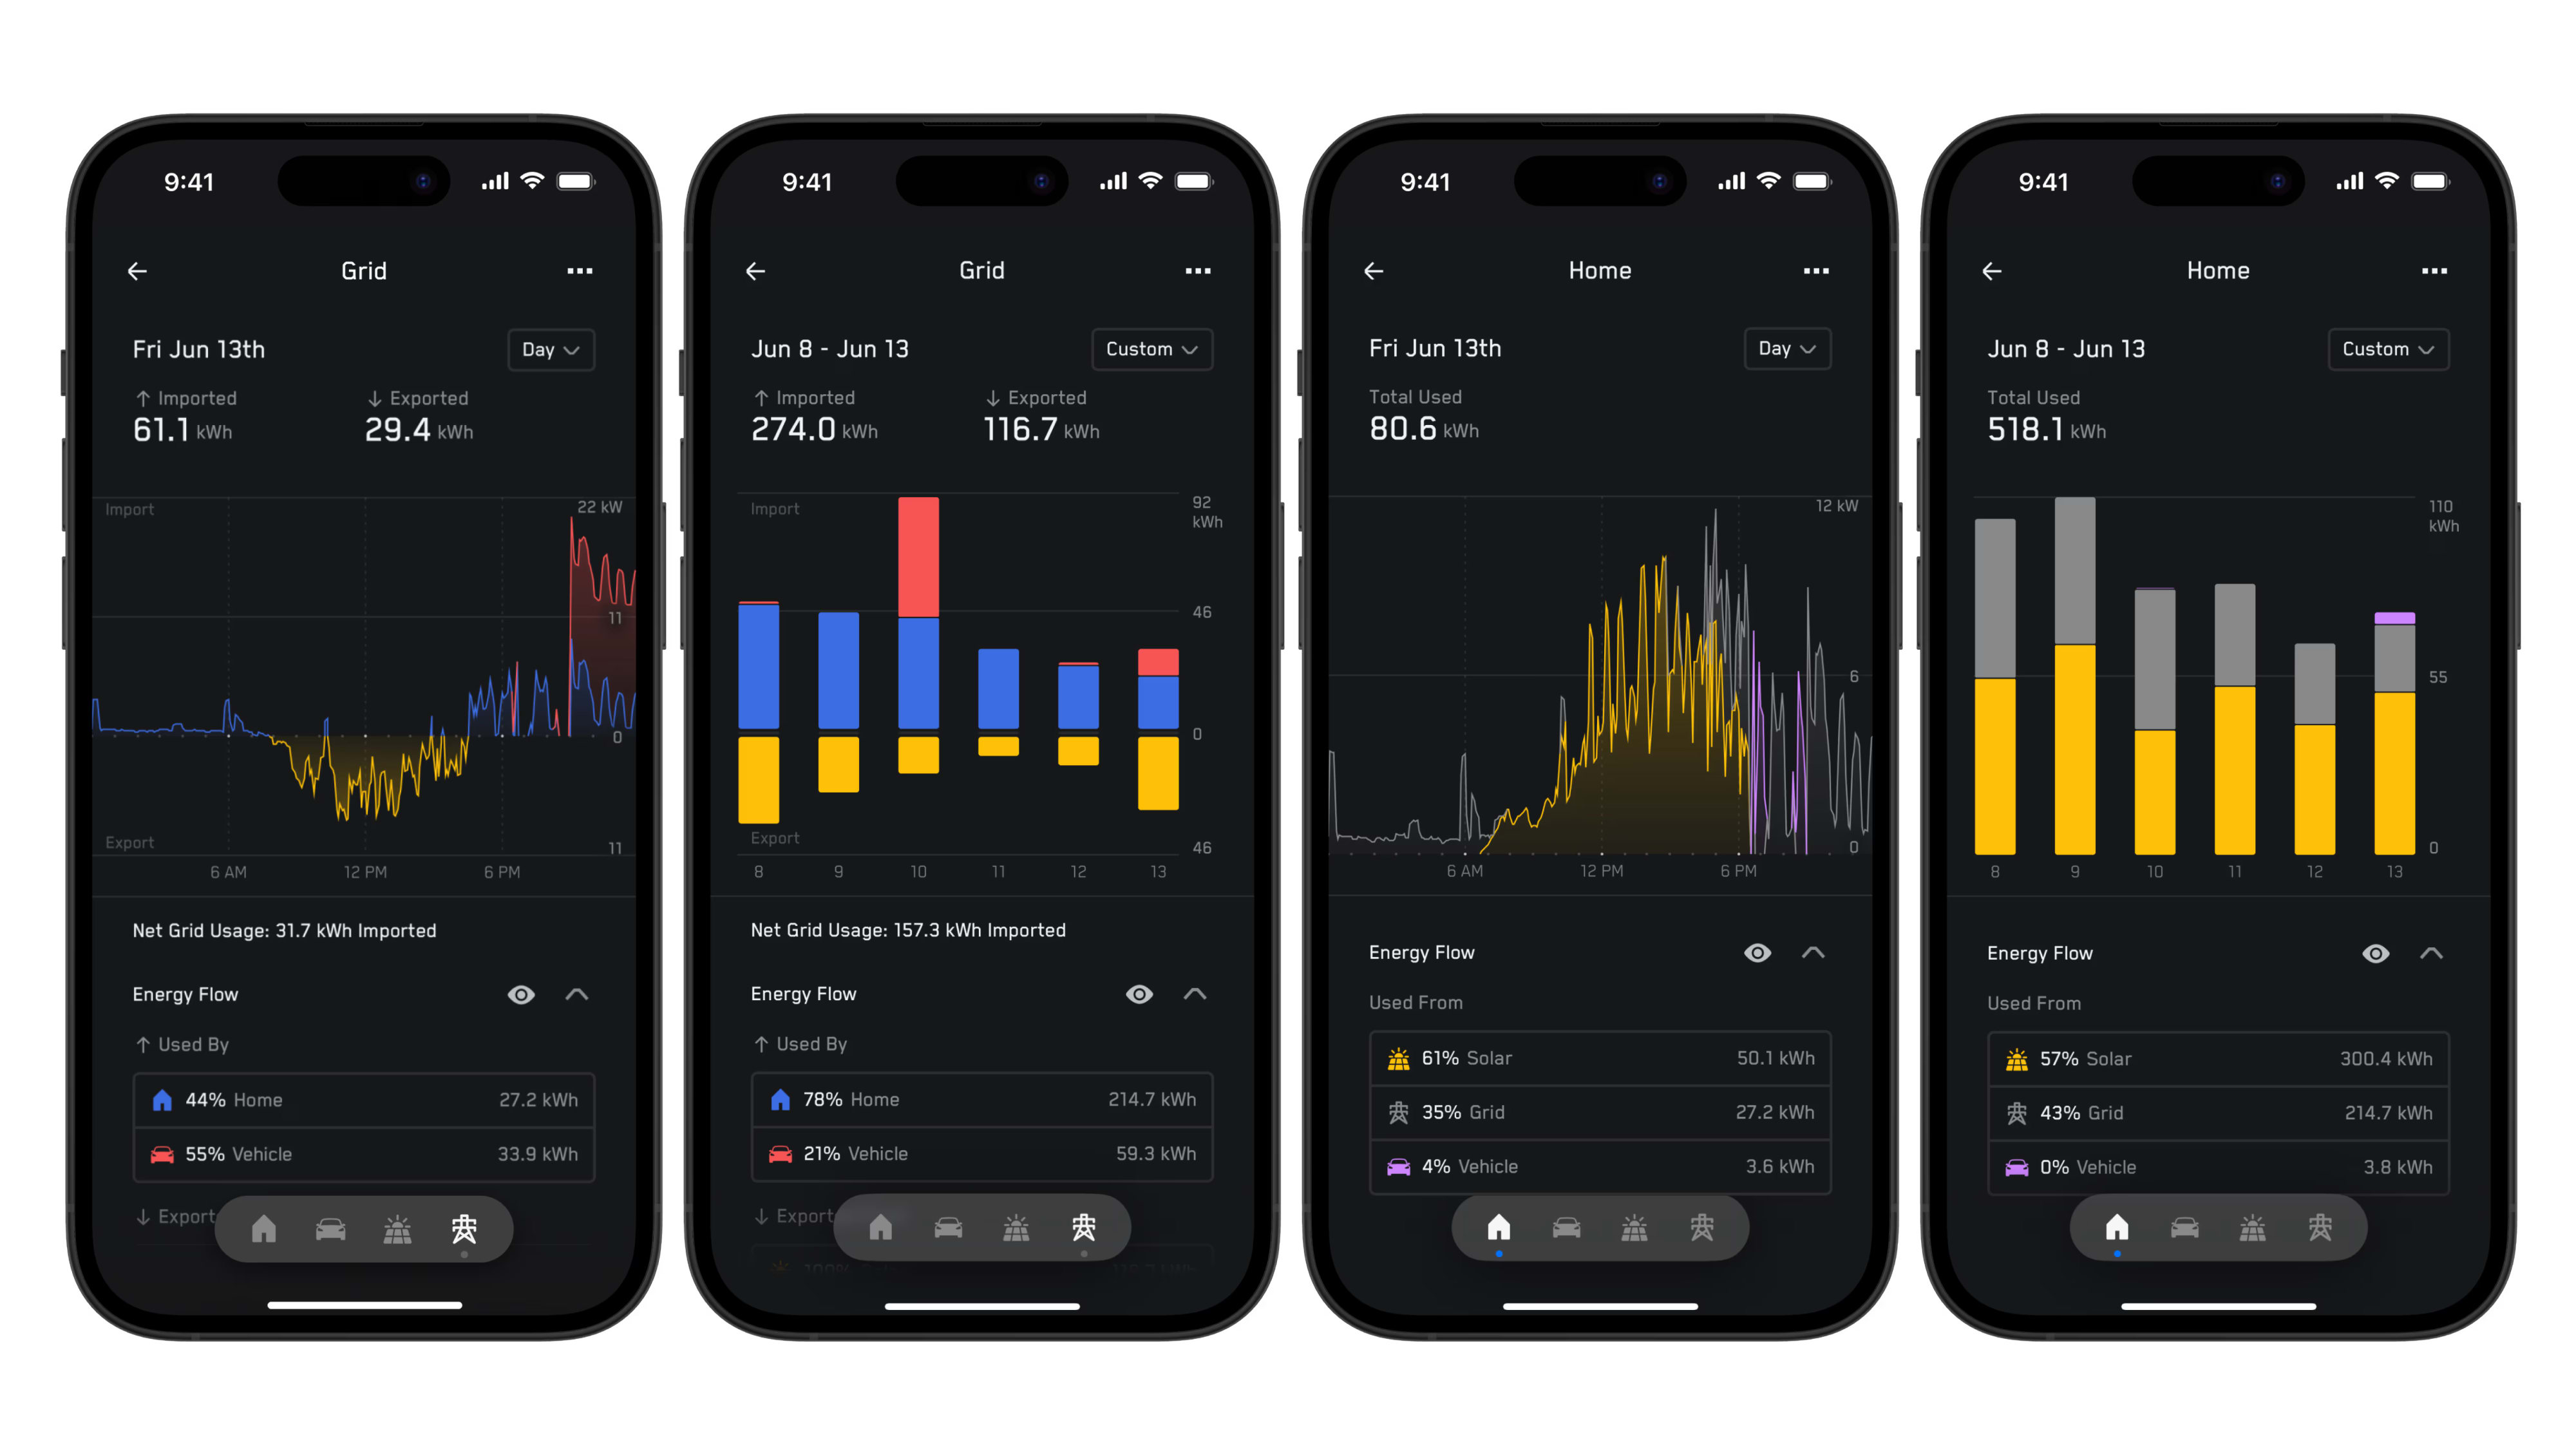
Energy graphs are categorized by components of your energy system, with each graph displaying a key part of your home’s energy use and generation. For example, the Solar component shows your home’s overall solar production. To access your energy graphs, follow these steps:
- Open the Tesla app and switch to your energy site.
- Tap ‘Energy.’
- Tap the icon for the component that you would like to view in the bar at the bottom of the screen.
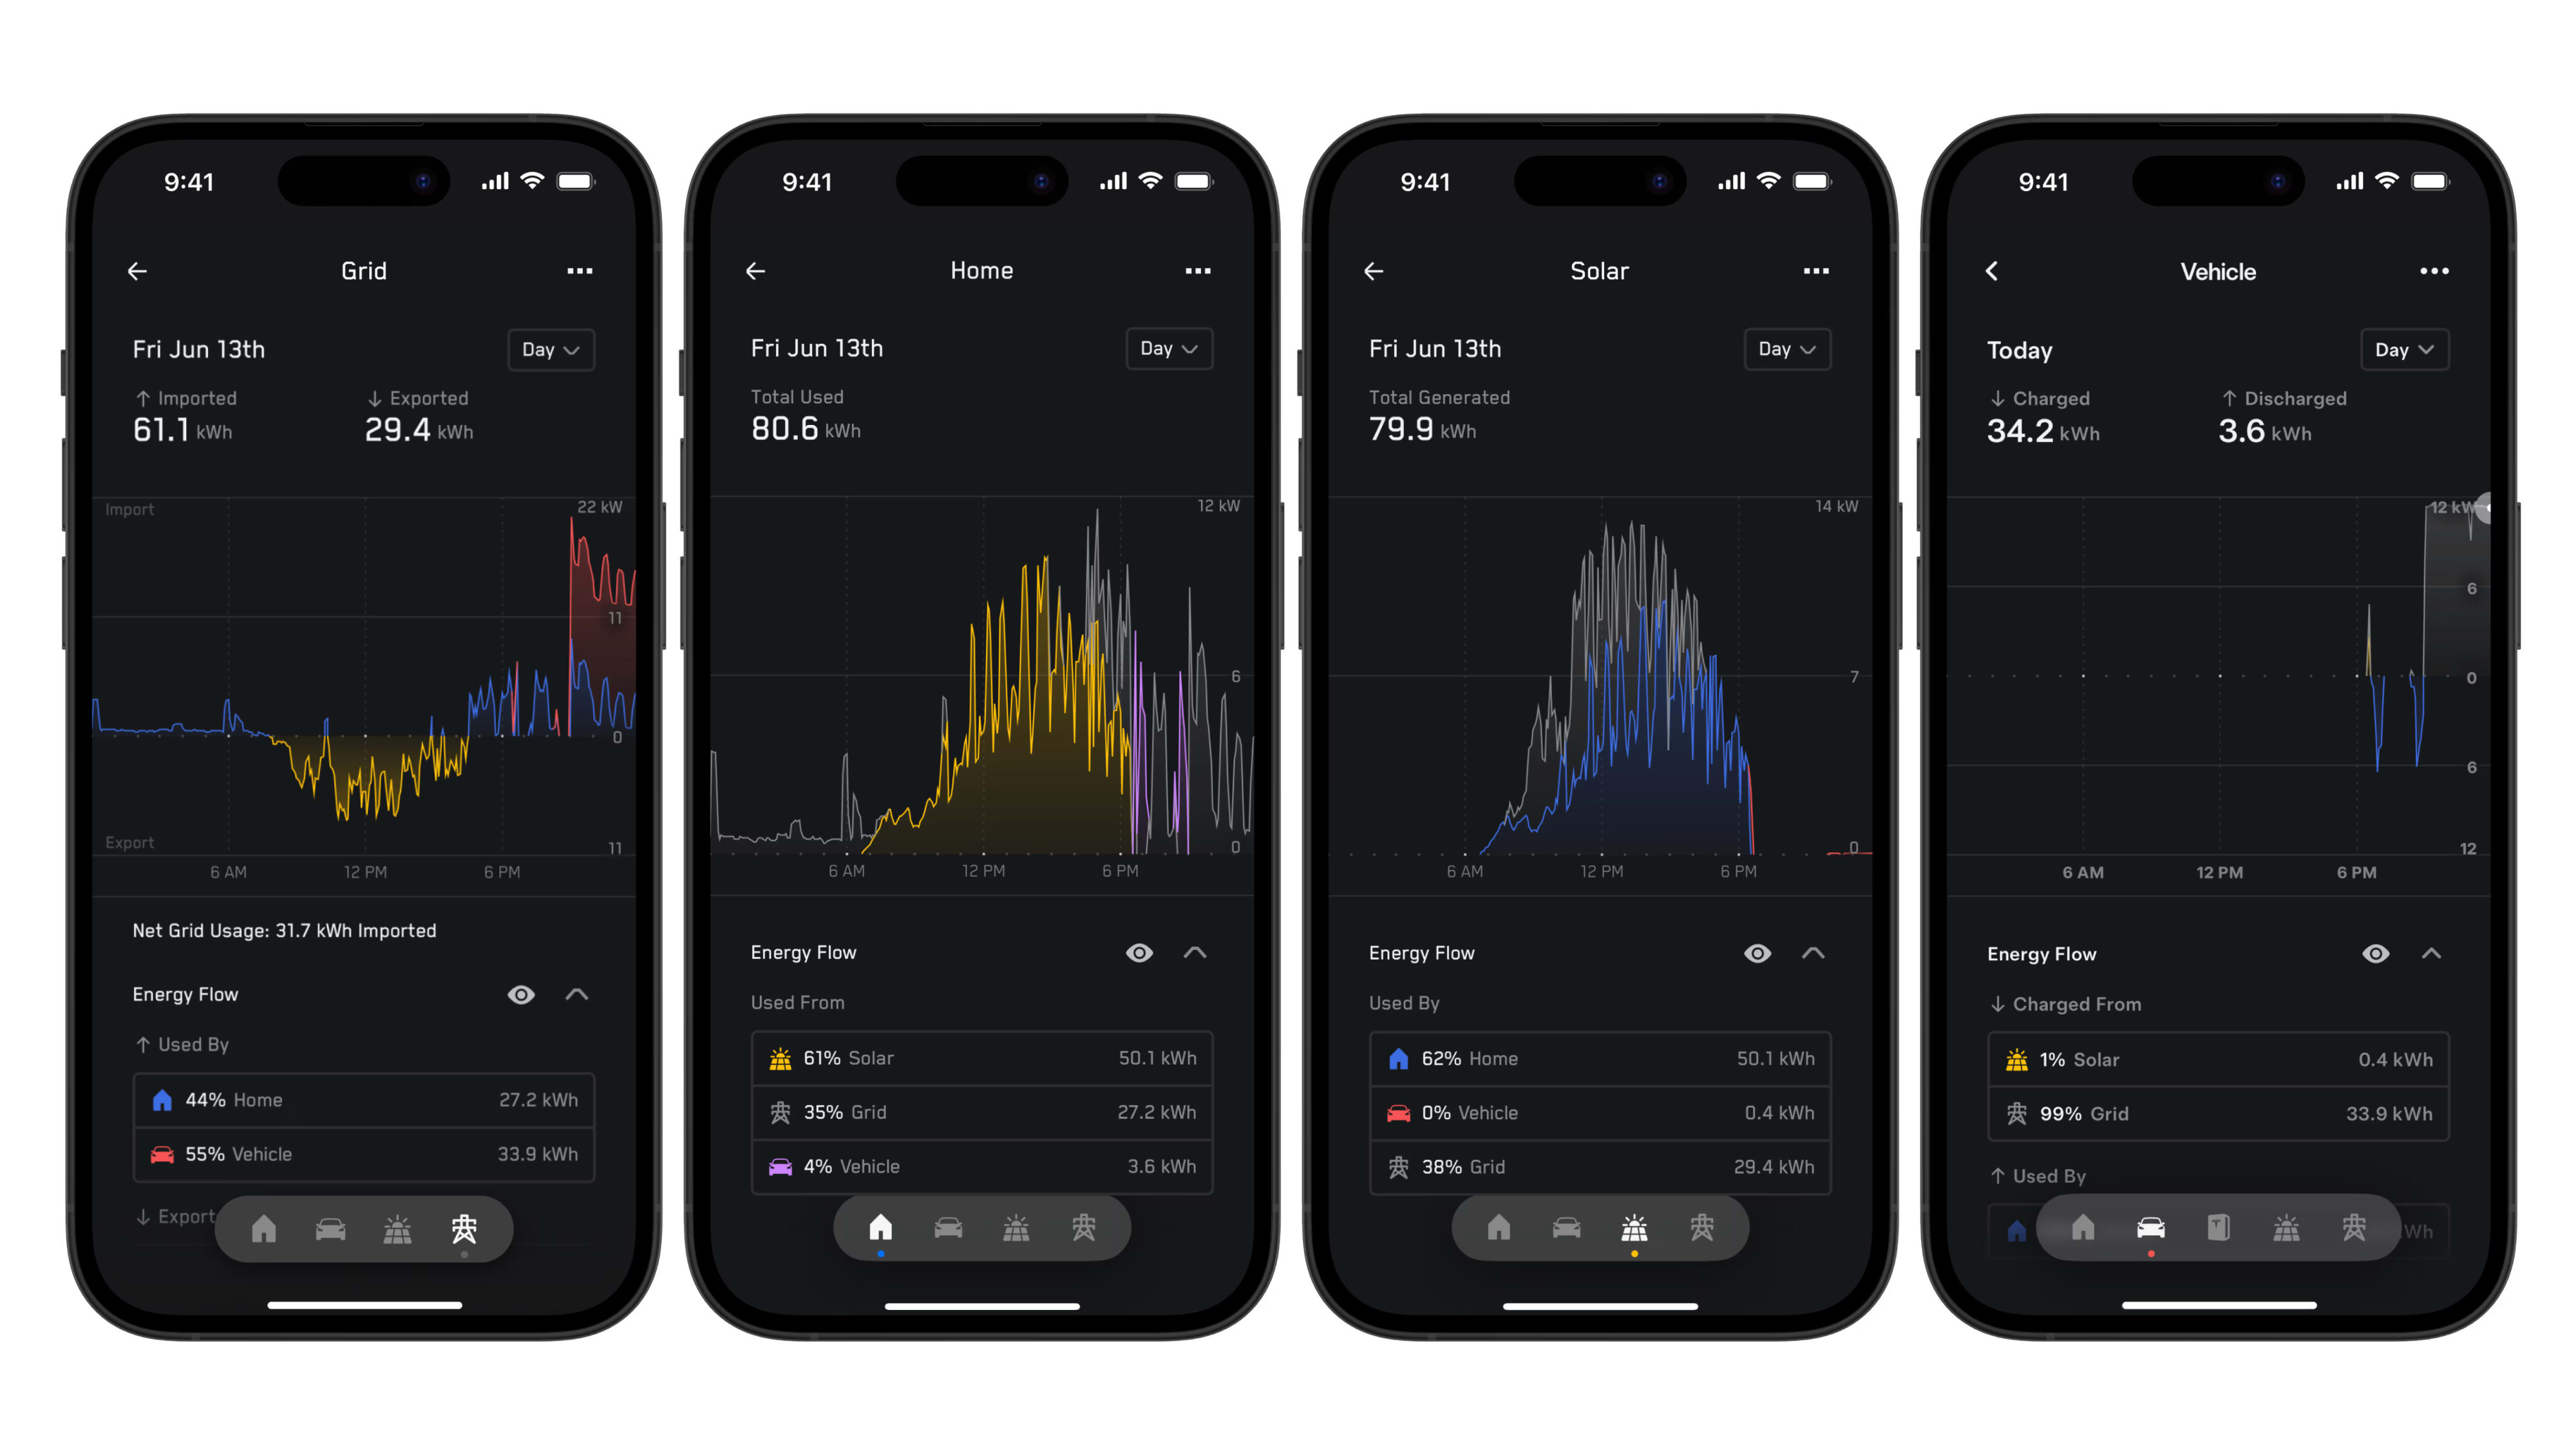
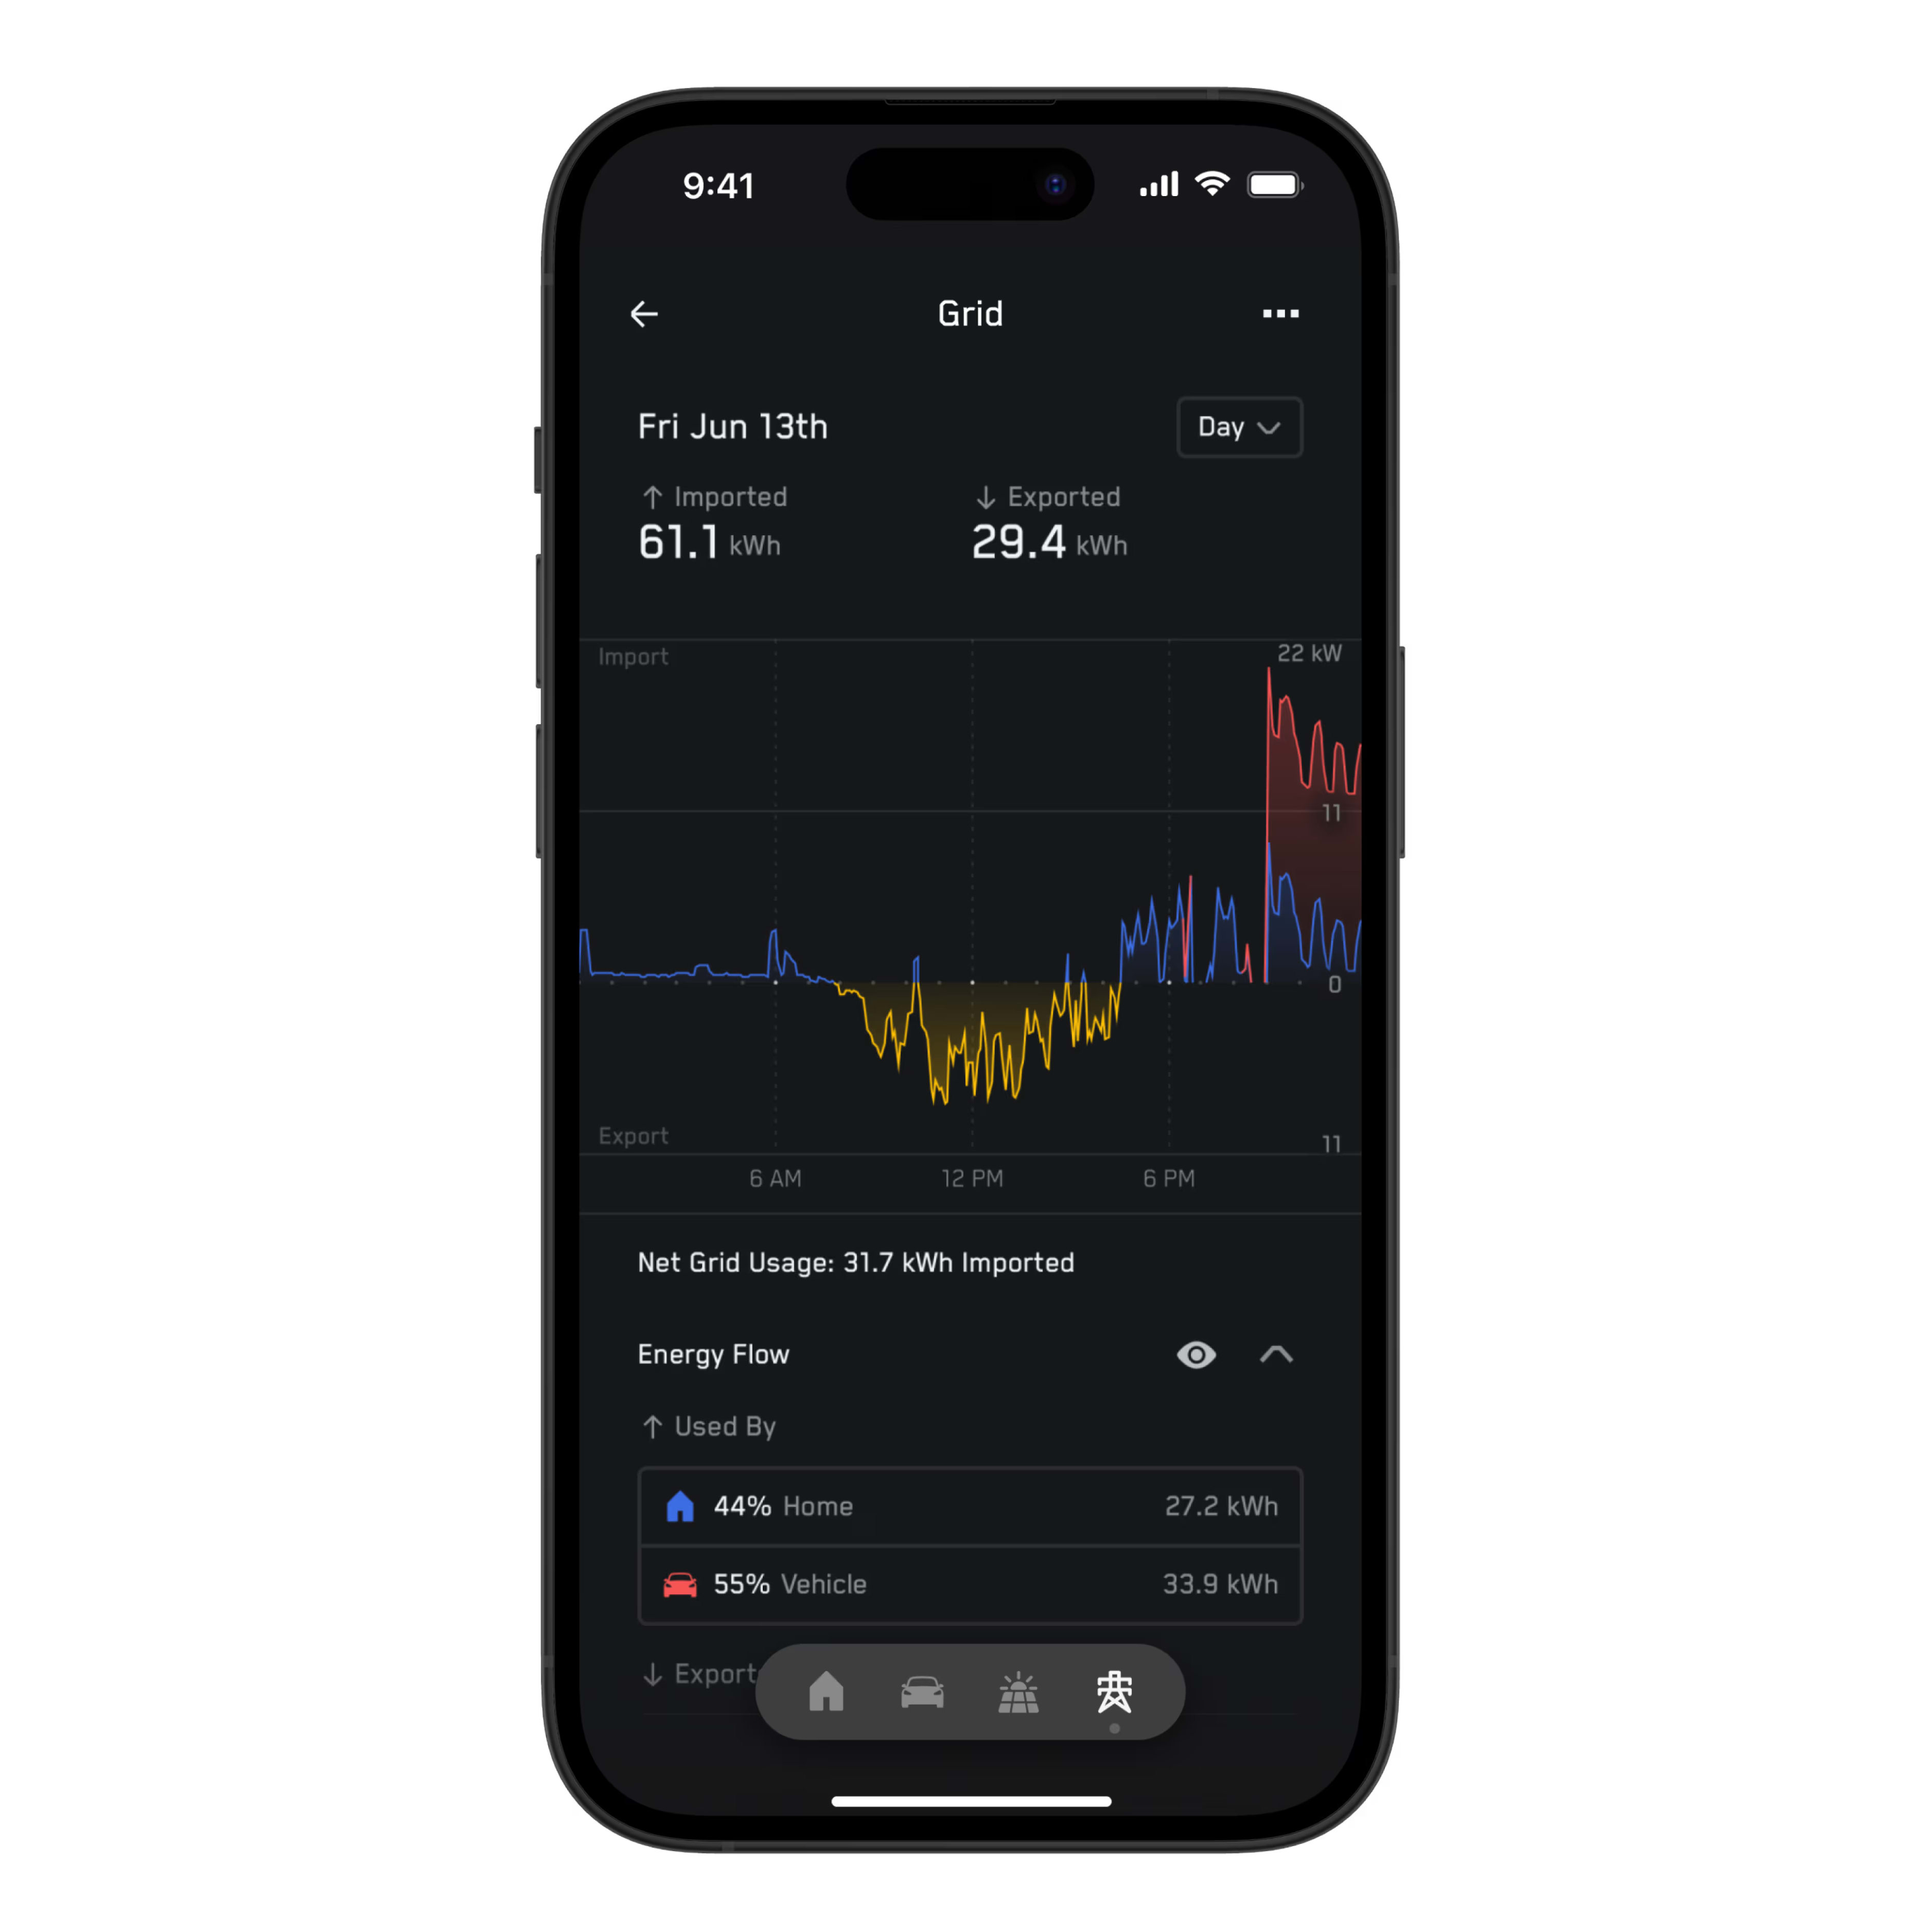
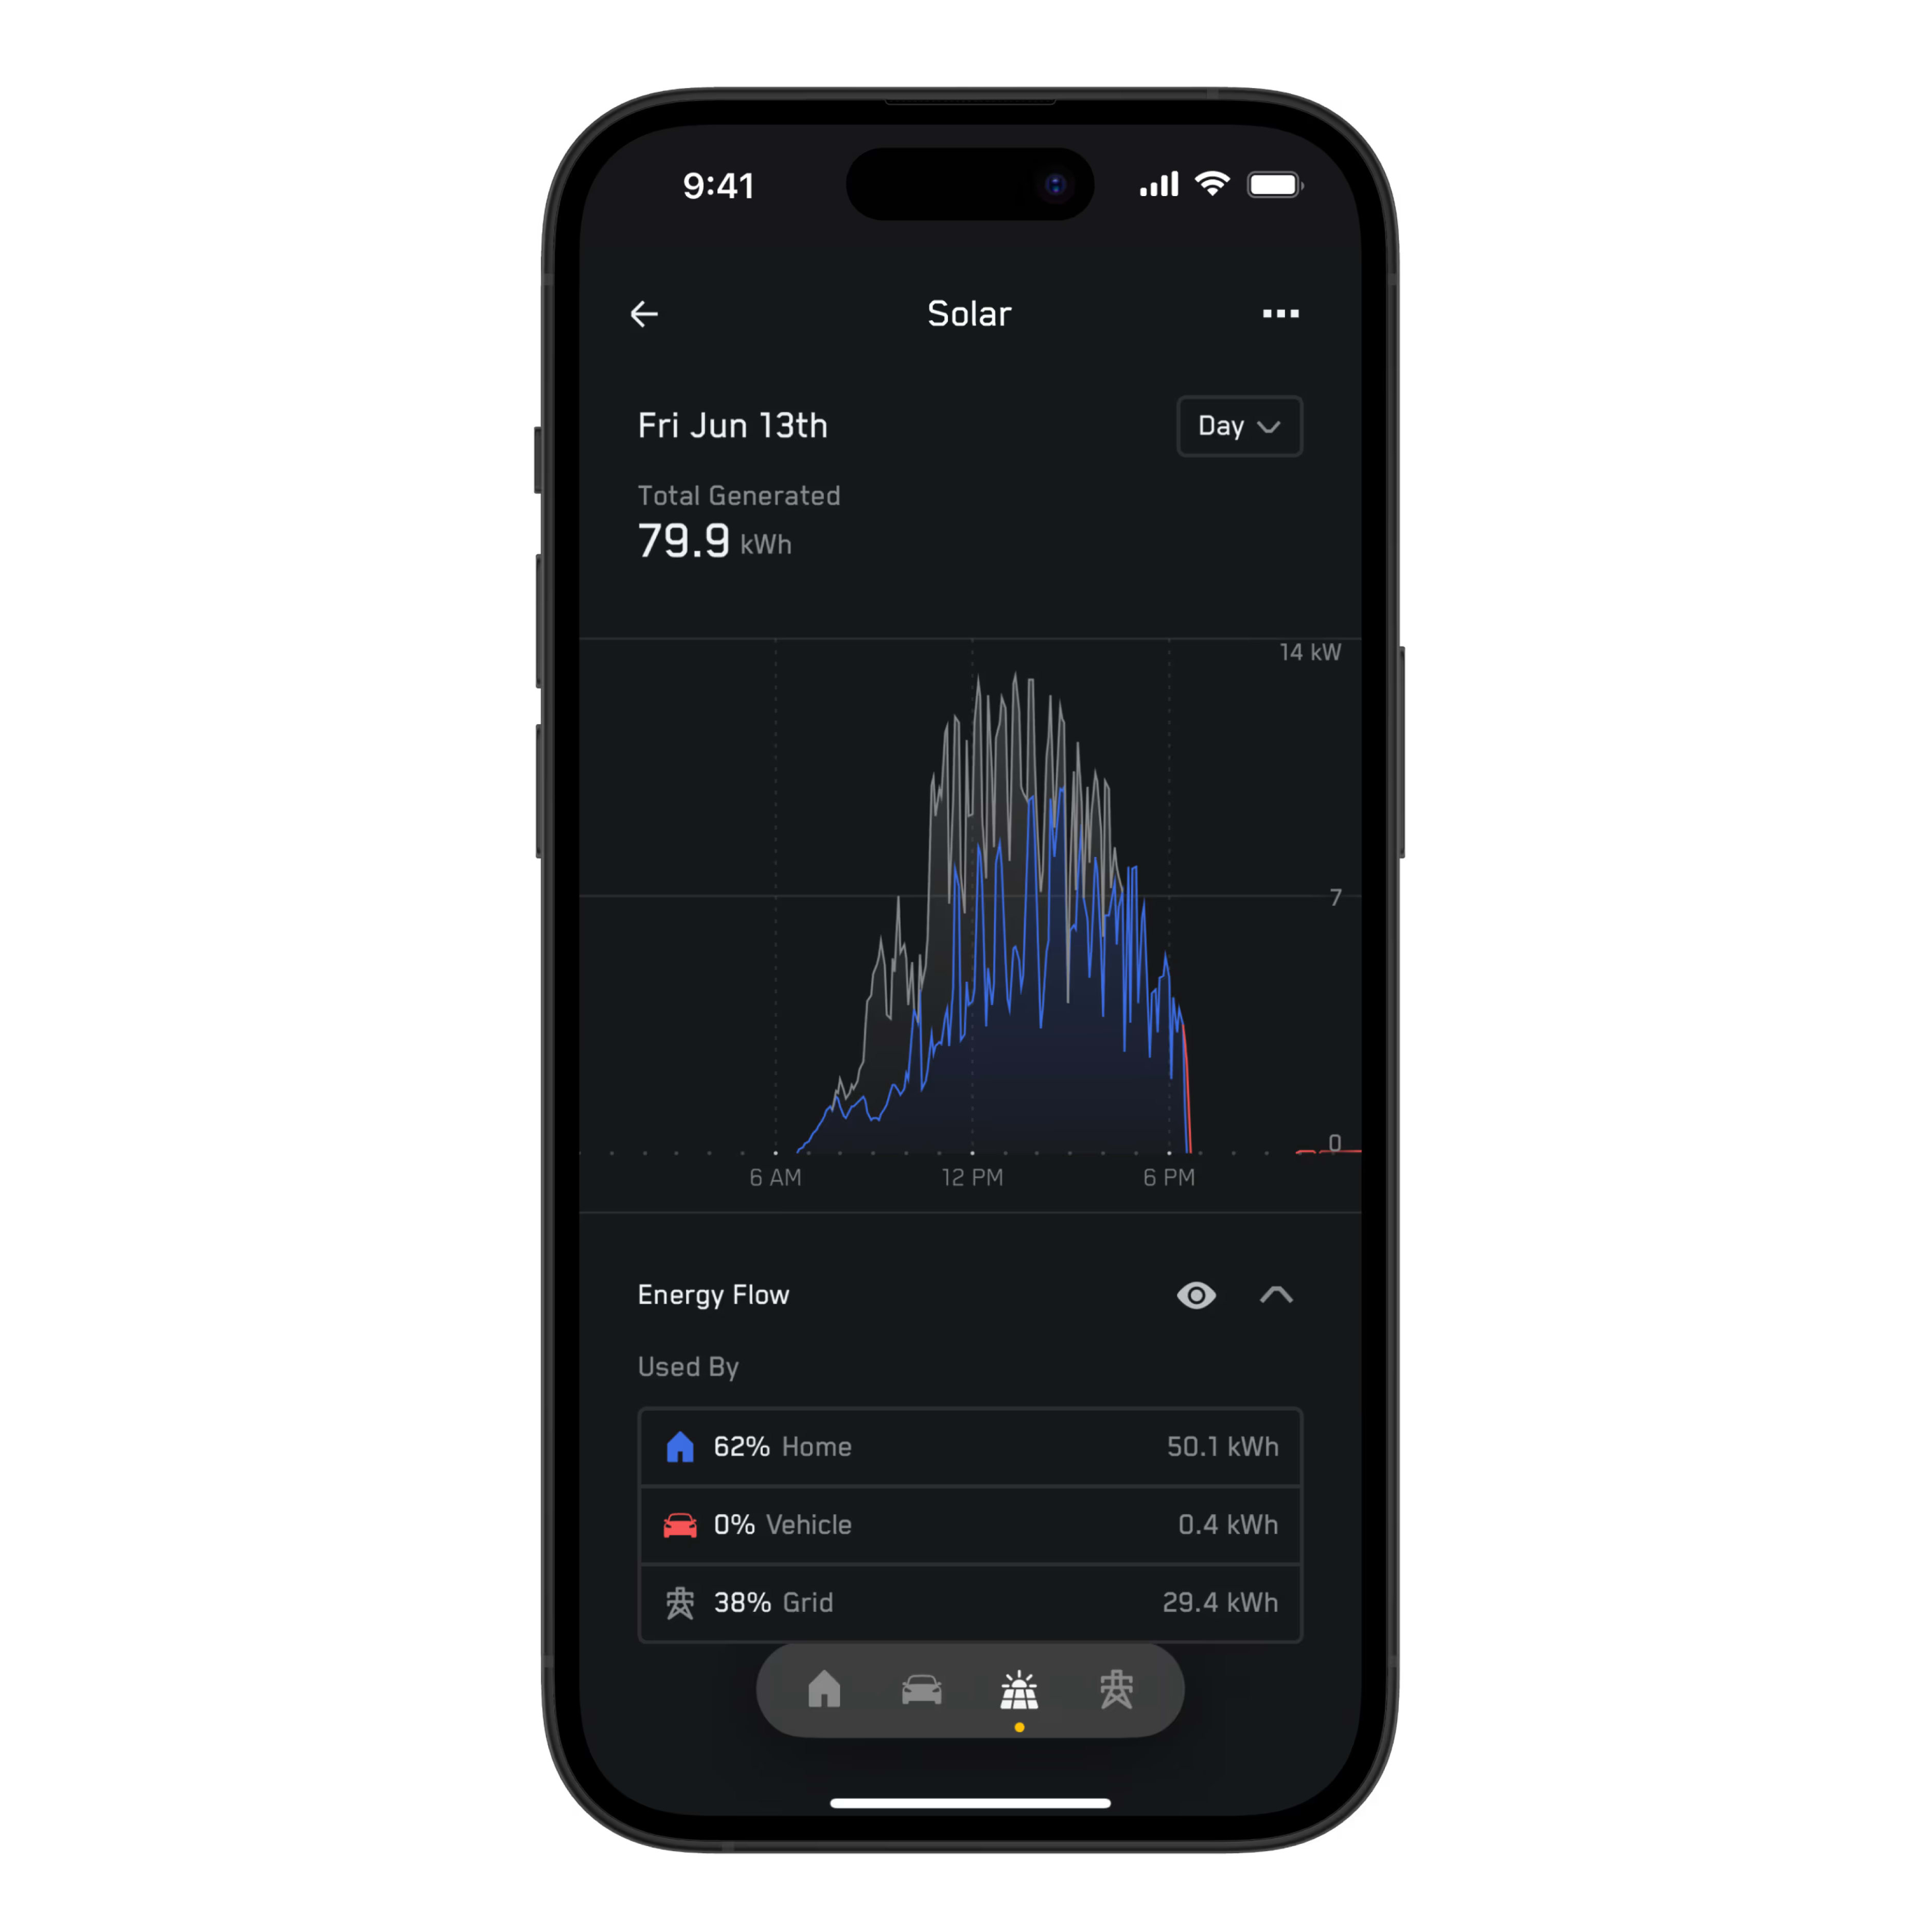
The size of the graph data is relative to the amount of energy generated or consumed. For example, data for solar produced on a rainy day may be smaller than data for large amounts of excess solar that was exported to the grid. A kW will have the same visual height across all components, and the graph axis will rebalance as you swipe between days. You can also access a simplified view of the overall impact your energy system has had on your home over longer periods of time.
Energy Flow
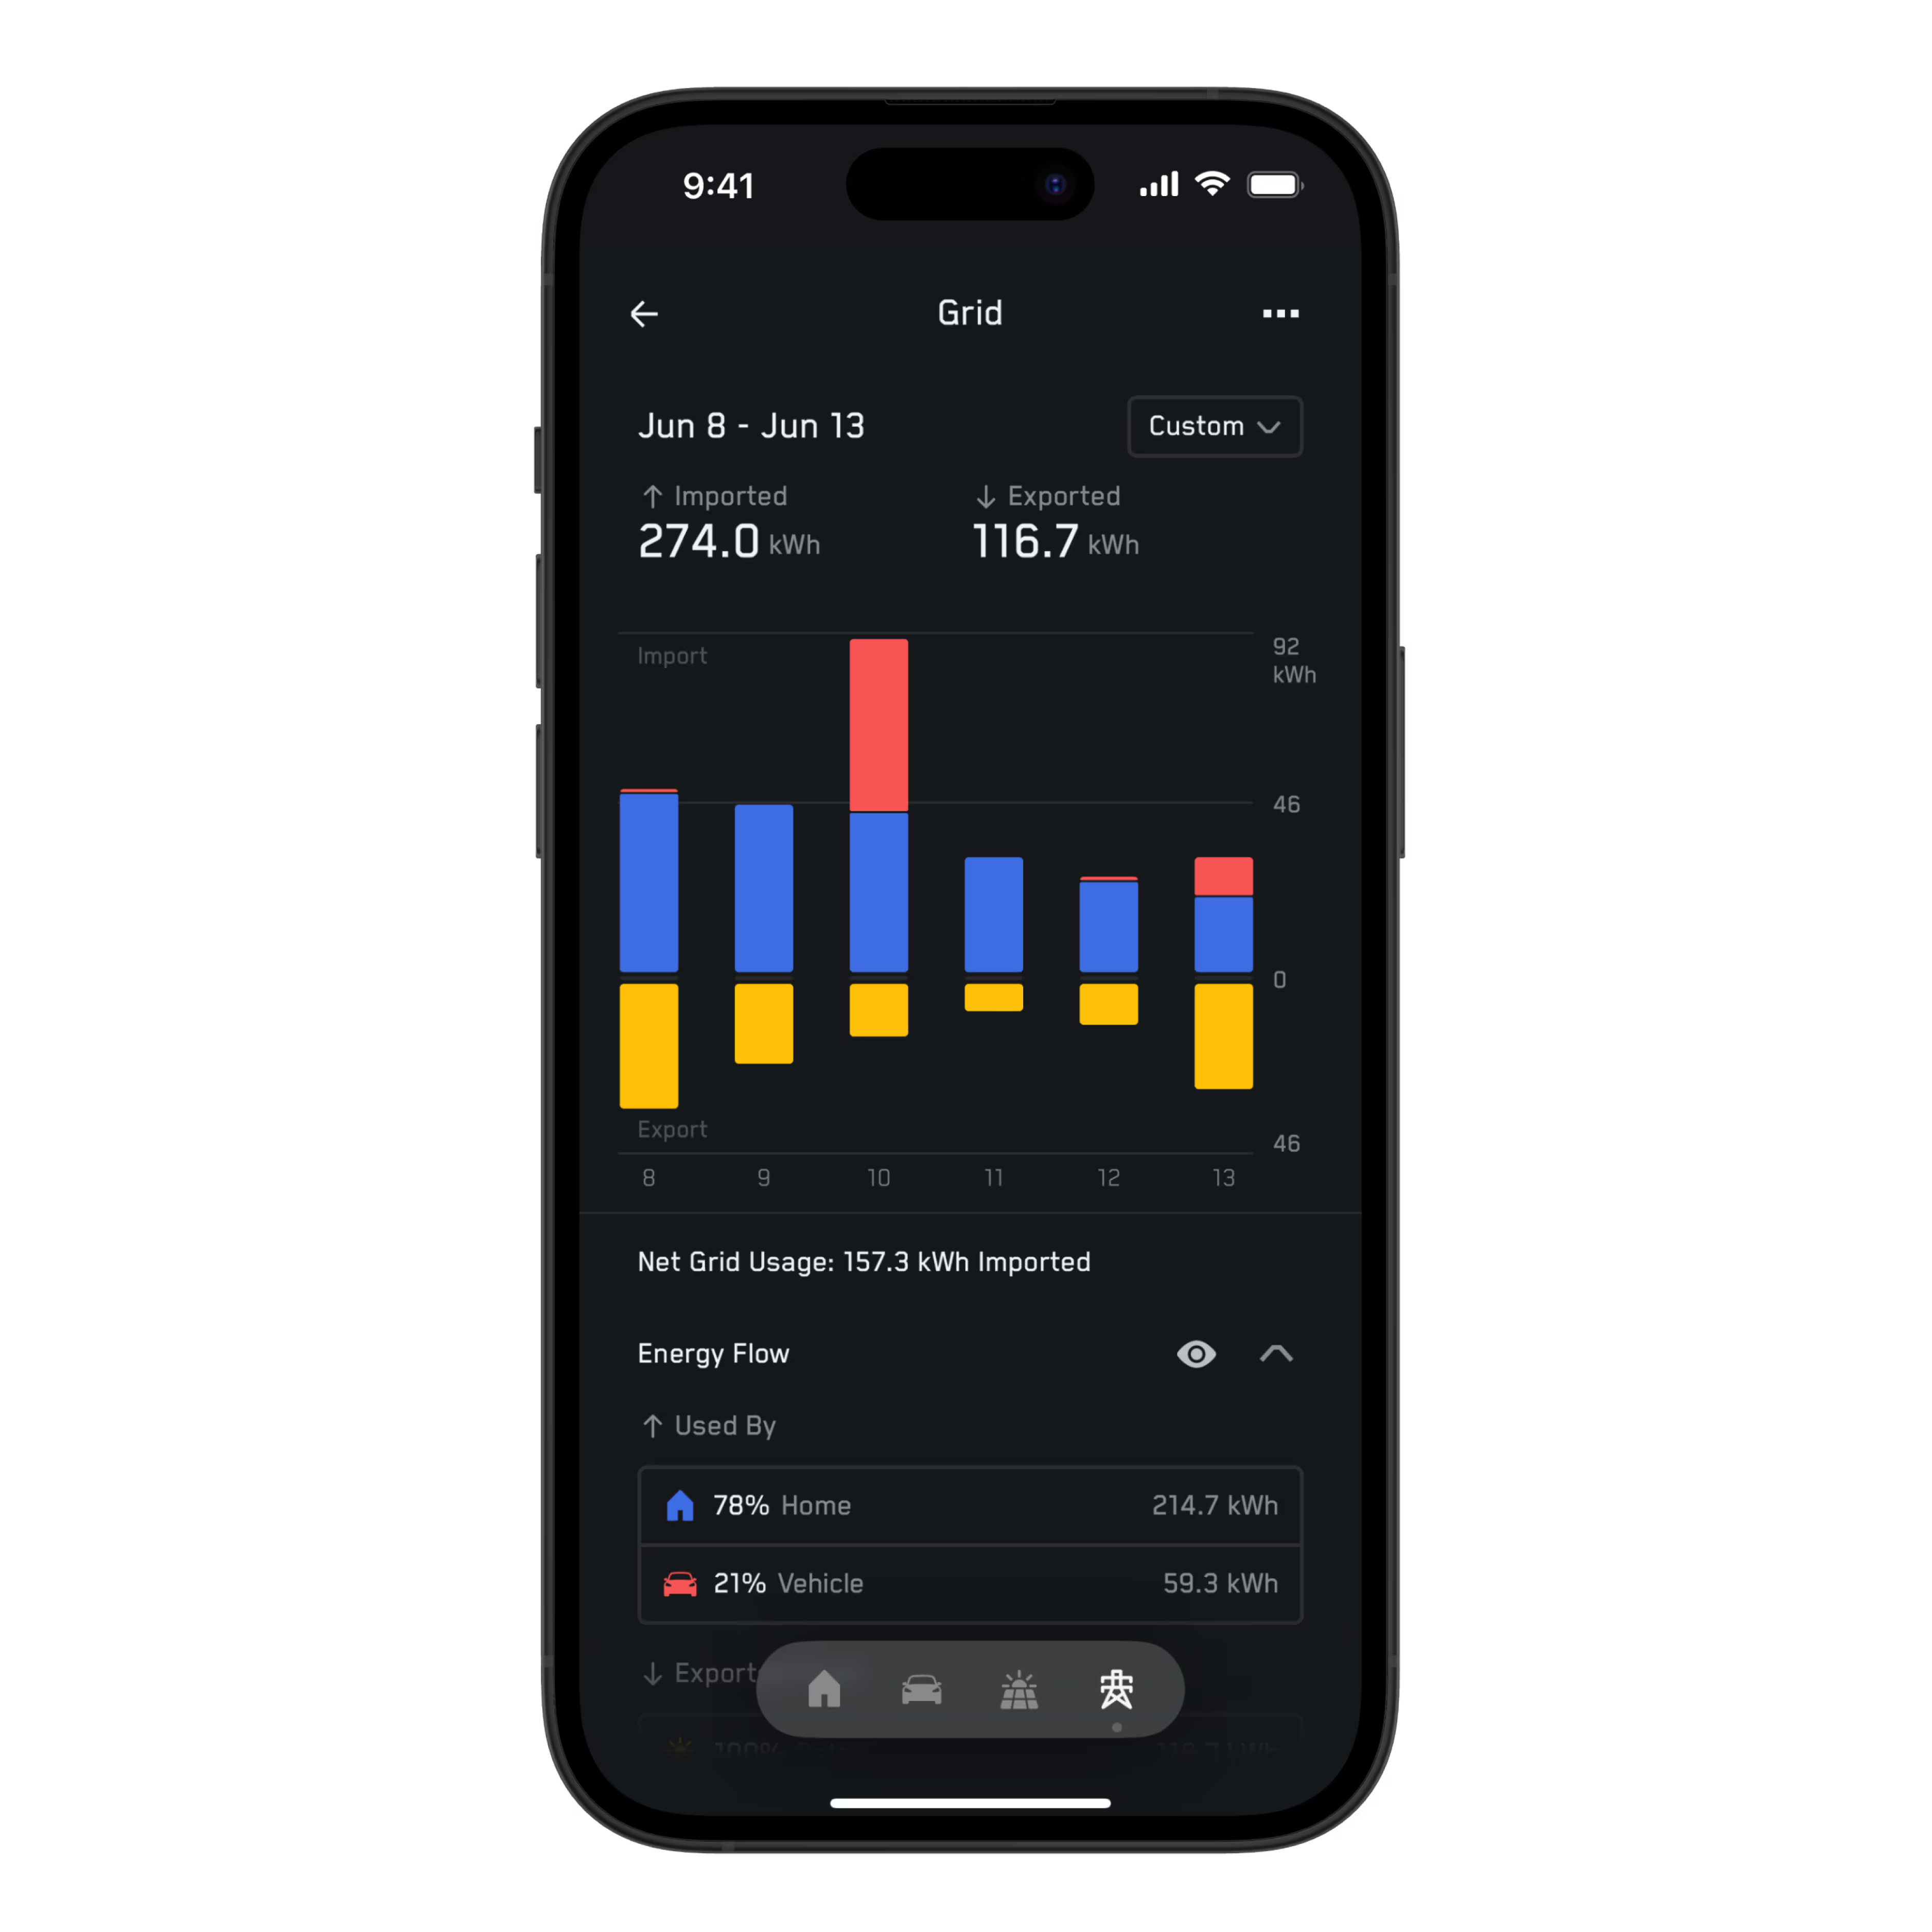
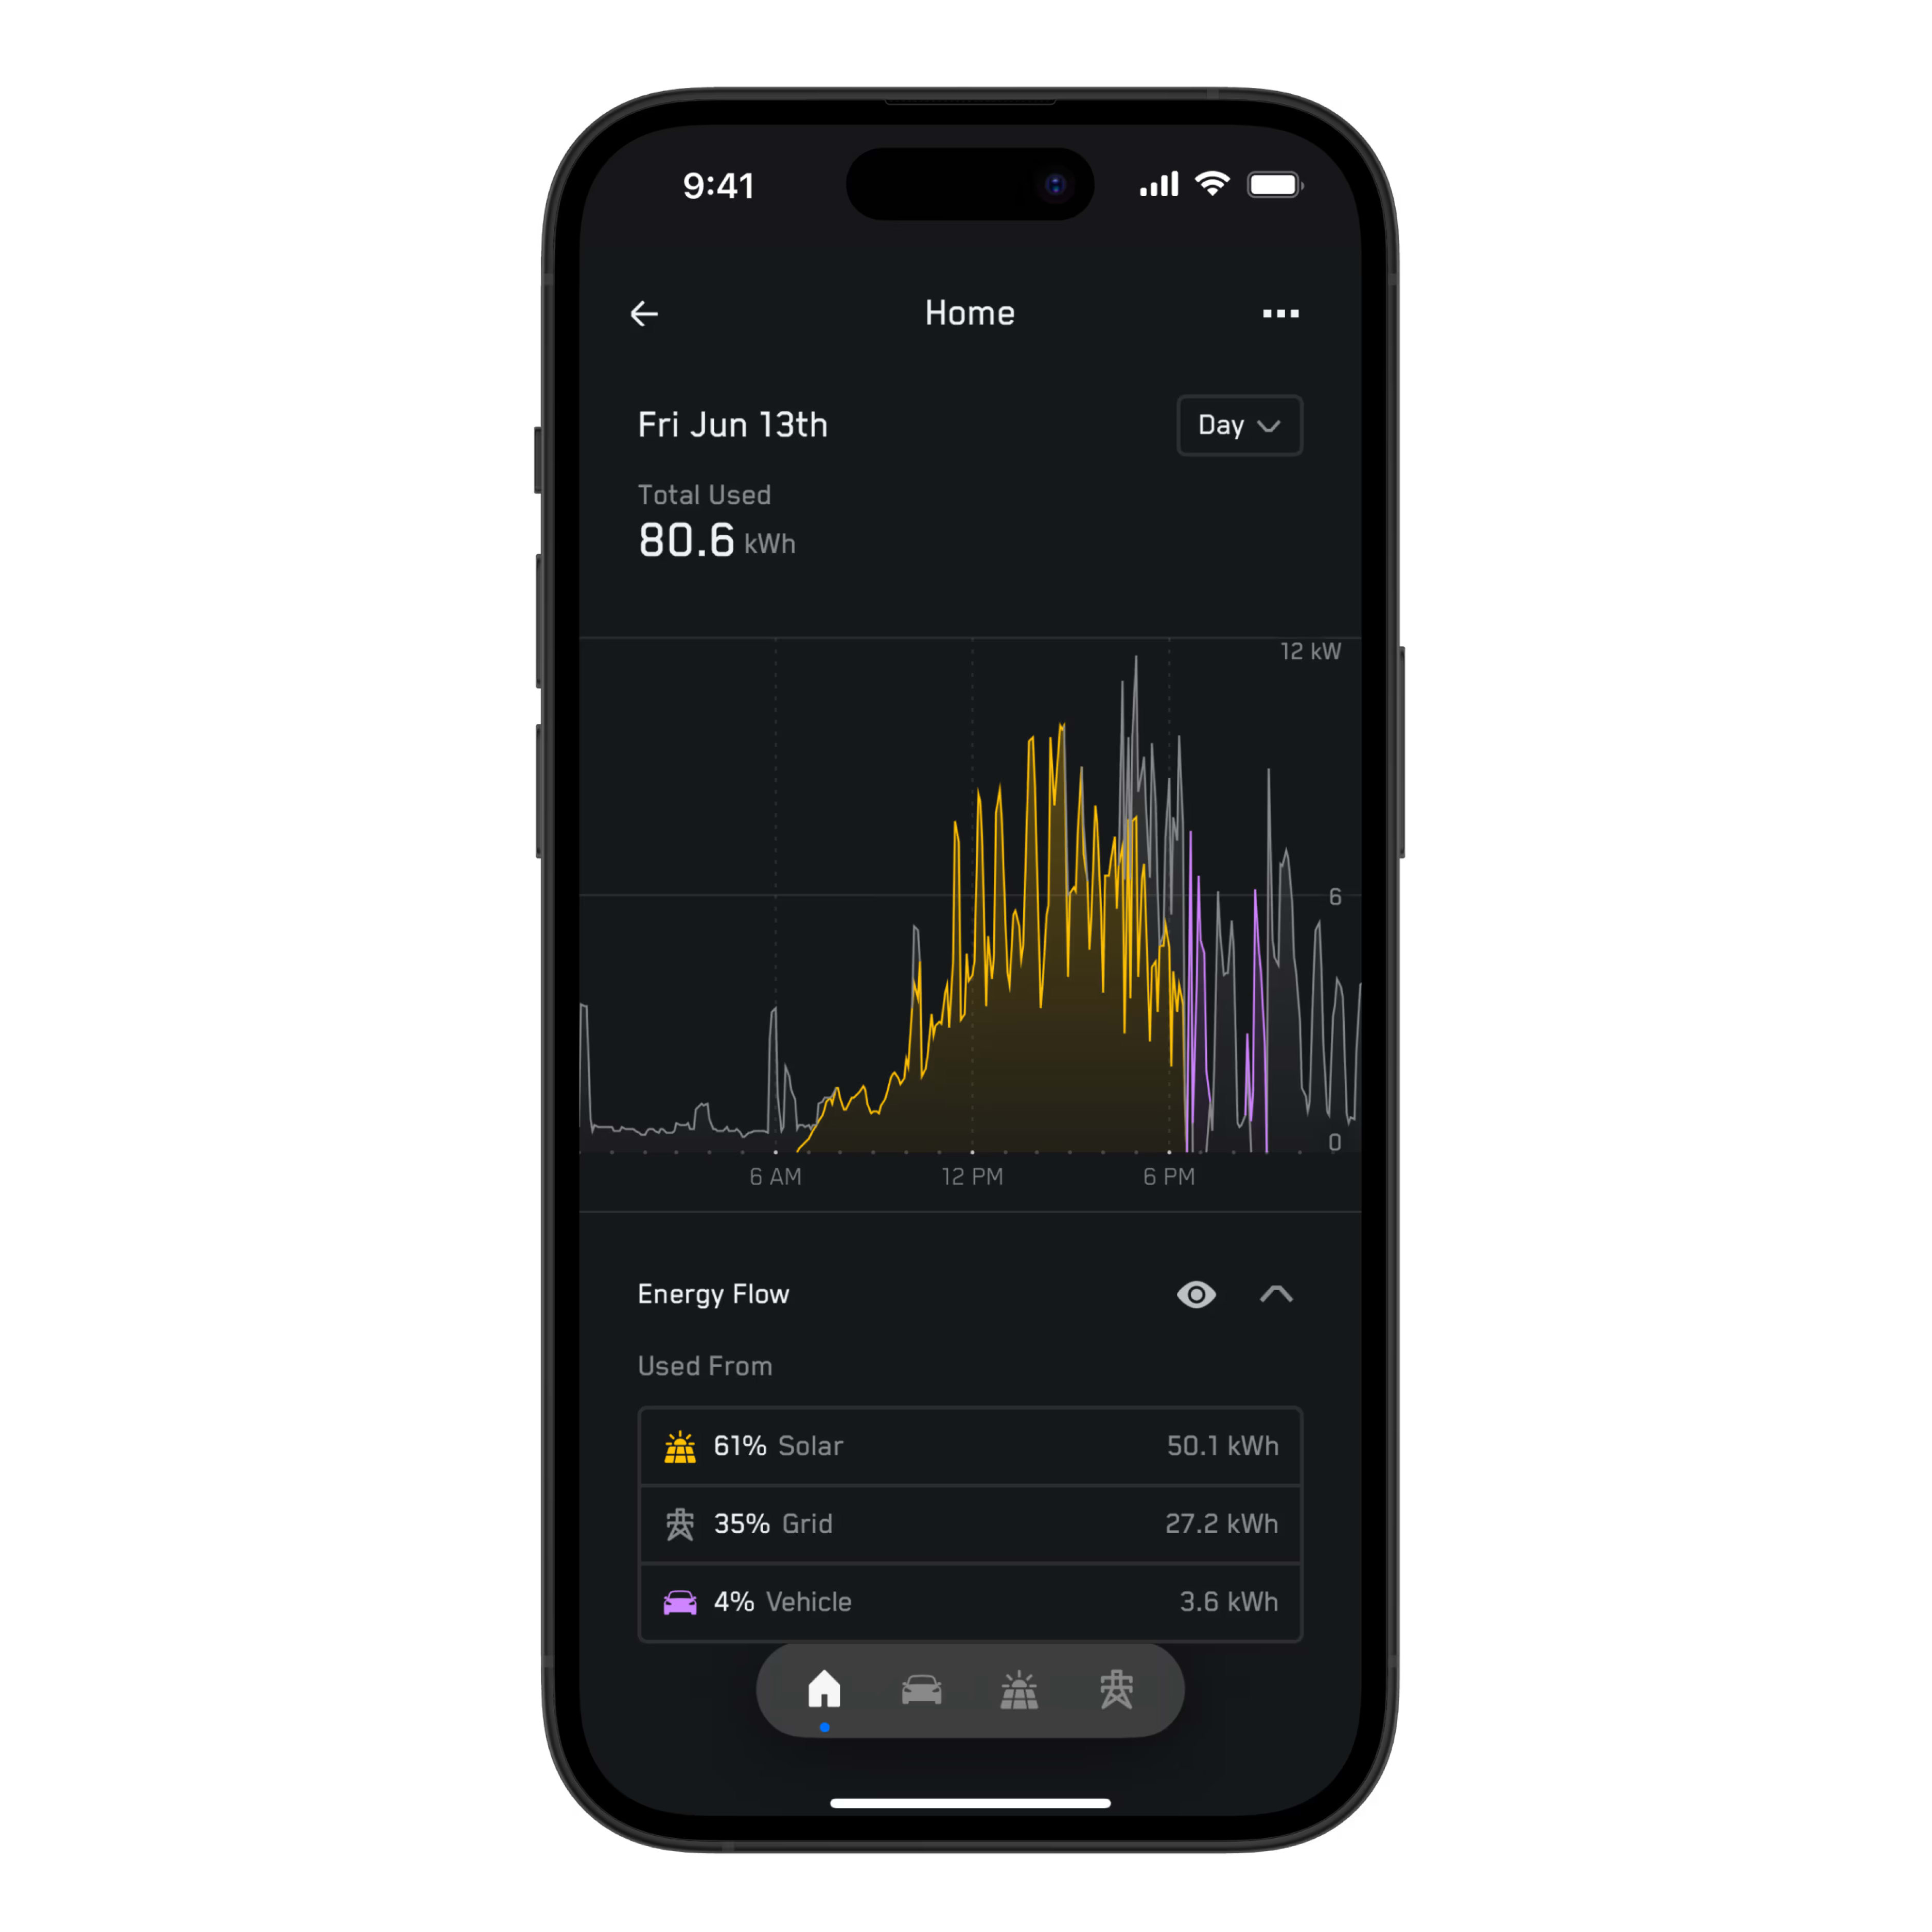
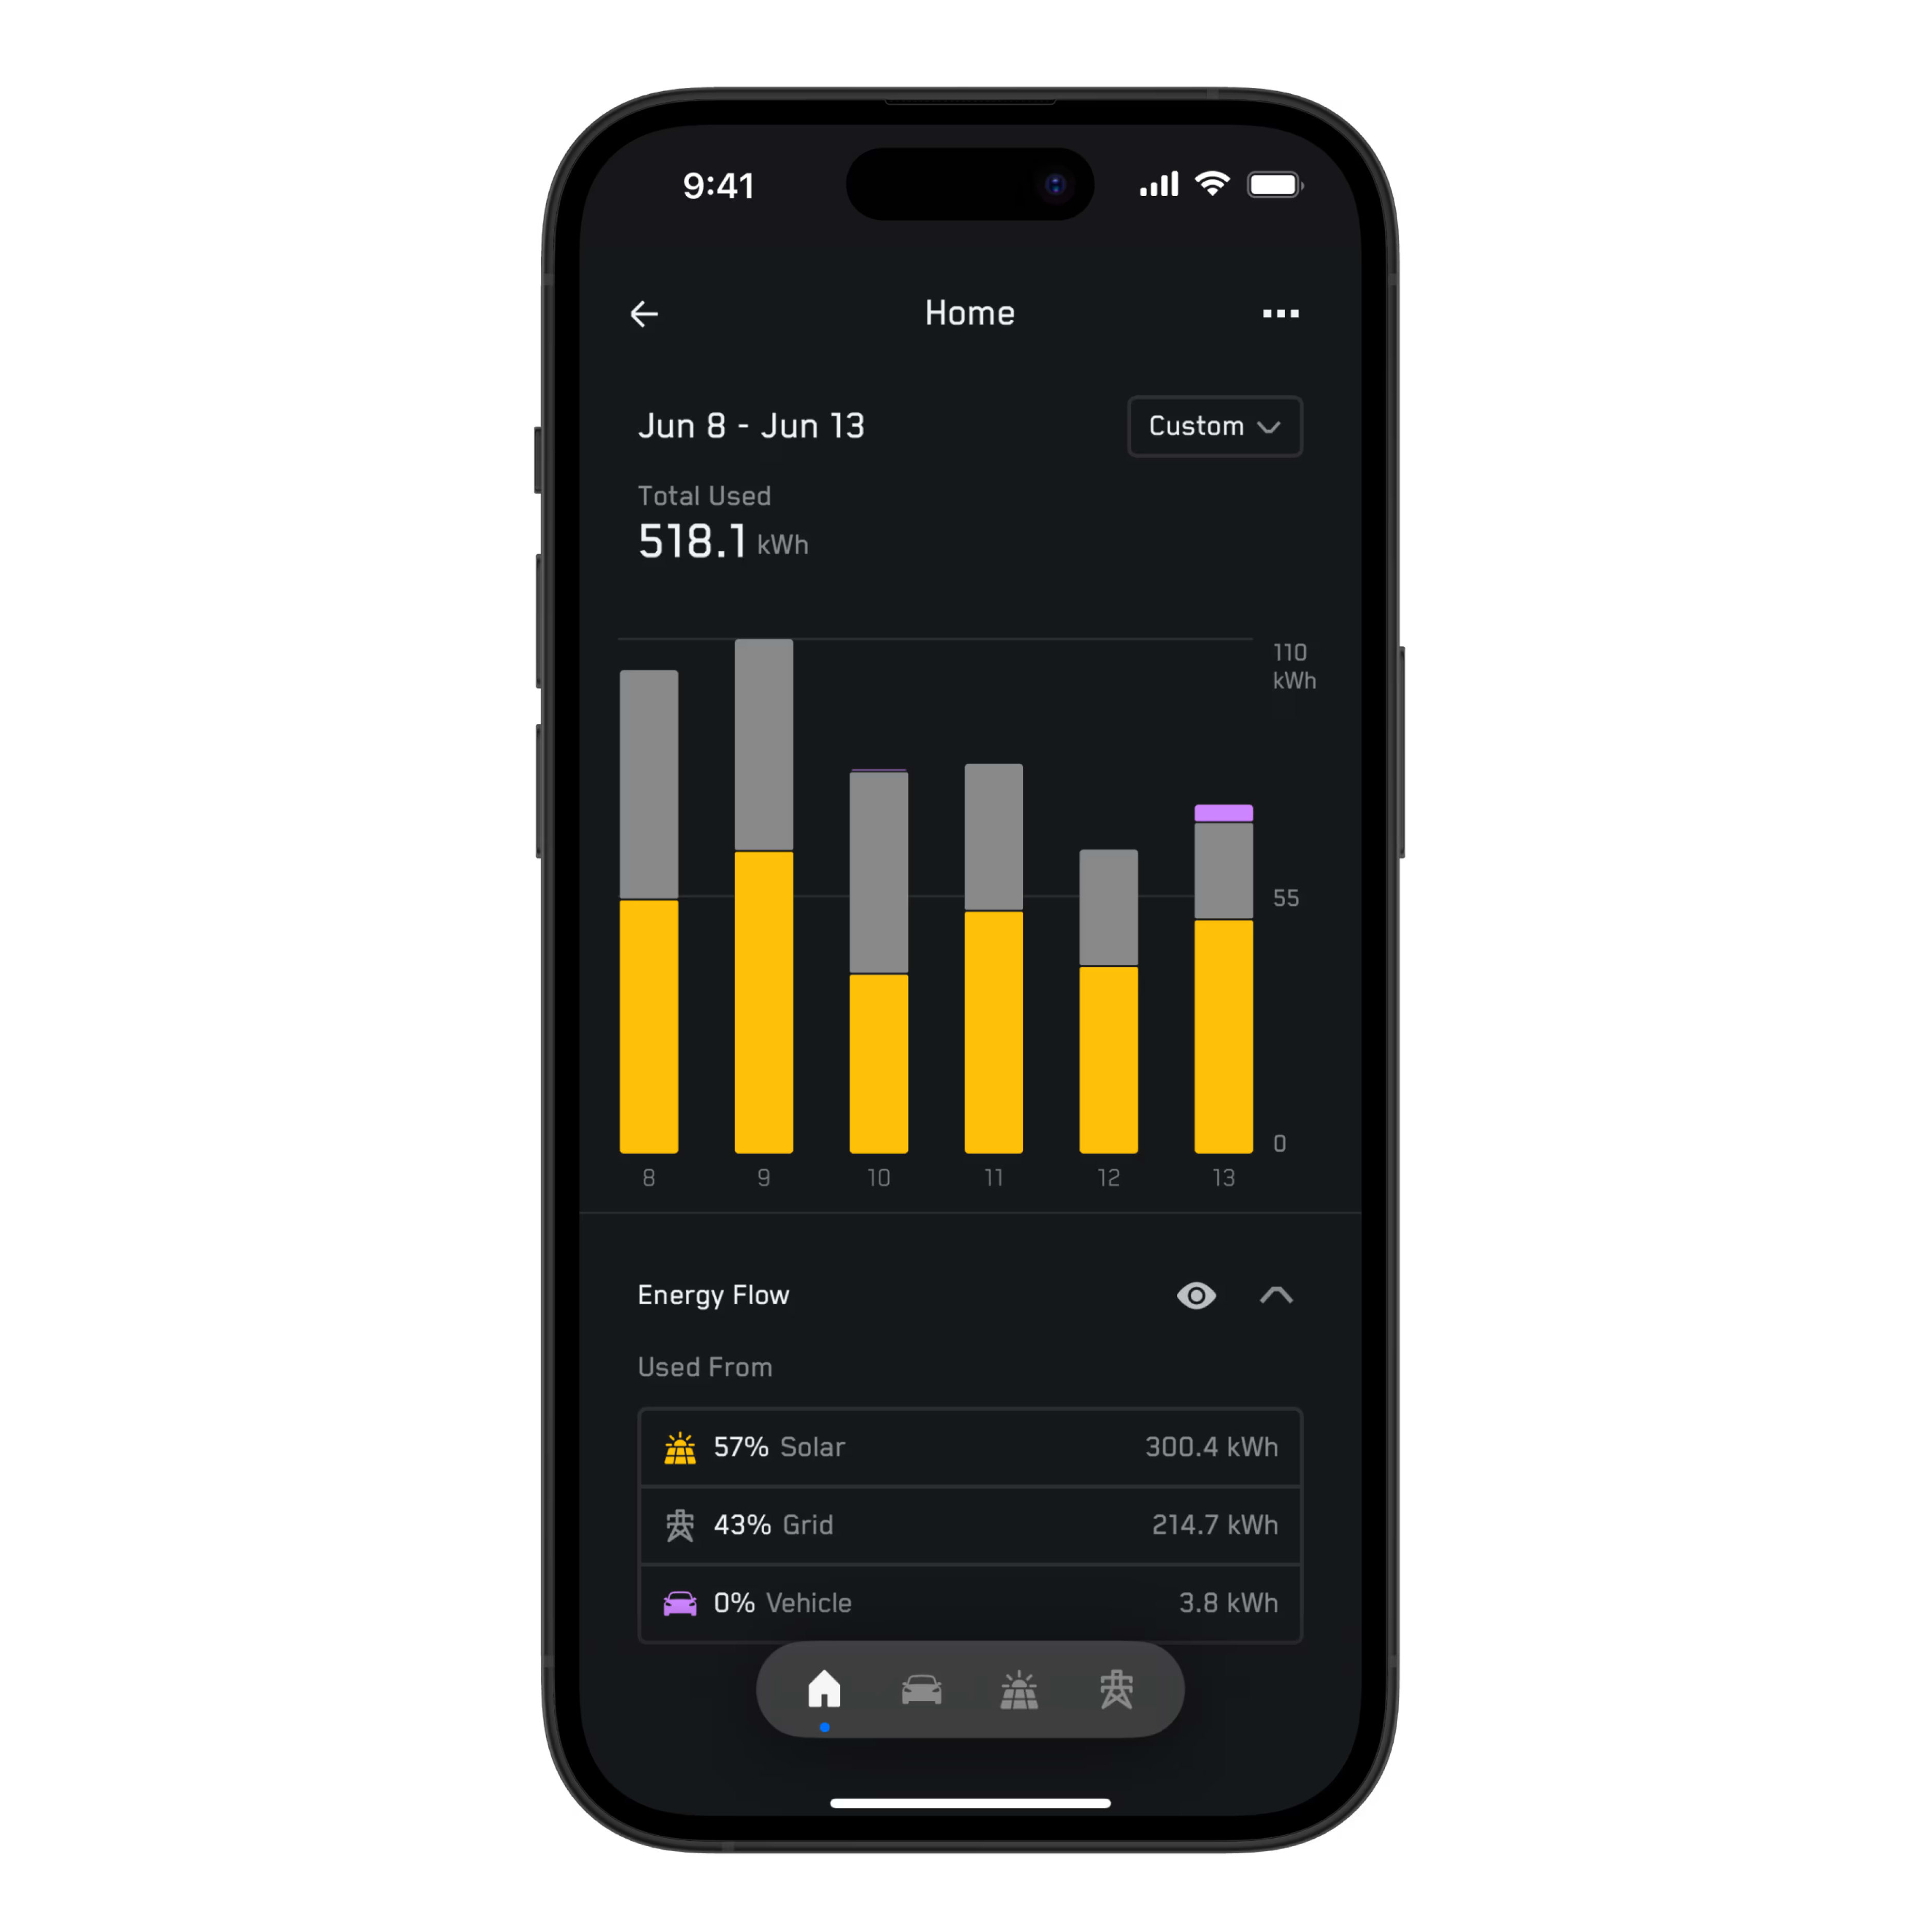
The data in the energy flow section shows total imports and exports per component in percentage and kilowatt hours (kWh). You can tap an energy flow row to transform your graphs and better understand where each component is exporting energy to or using energy from. For example, with Powershare, your vehicle, which normally uses energy from the grid or solar, can also export energy to your home in the case of a power outage.
History and Timescales

Review all of your system’s historical data at any time in the Tesla app.
Using these graphs, you can view data by day, month, year or lifetime. Use the timescale selector in the top right corner — it defaults to Day — to switch between these views. On the Day view, the energy graph will display stacked area charts with timestamps of the power data. The Month, Year and Lifetime views use bar charts to visualize total energy.
Swipe sideways along the middle of the screen to go back and forth between time periods.
You can also access and review data from a specific day, month or year in the past by opening the timescale selector and tapping ‘Choose Date.’ To return to the most recent data available, open the timescale selector and tap ‘Go to Today.’
Scrubbing
Tap and hold on the graph view to scrub and review data from specific timestamps. For example, you can scrub and see that your solar generated a peak power of 6 kW at noon.
If you have Energy Flow enabled, the scrubber shows the power values of each component at that timestamp, plus an aggregate total.
To enable Energy Flow for your graphs, tap the eye icon to the right of Energy Flow near the bottom of the graph screen. The colors used in the graph match the colors of other components in your system. You can also use Energy Flow to focus on one component in the graph. For example, you can view how much solar energy your home exported to the grid by tapping ‘Solar’ under ‘Exported From’ while the Grid component is selected.
Home
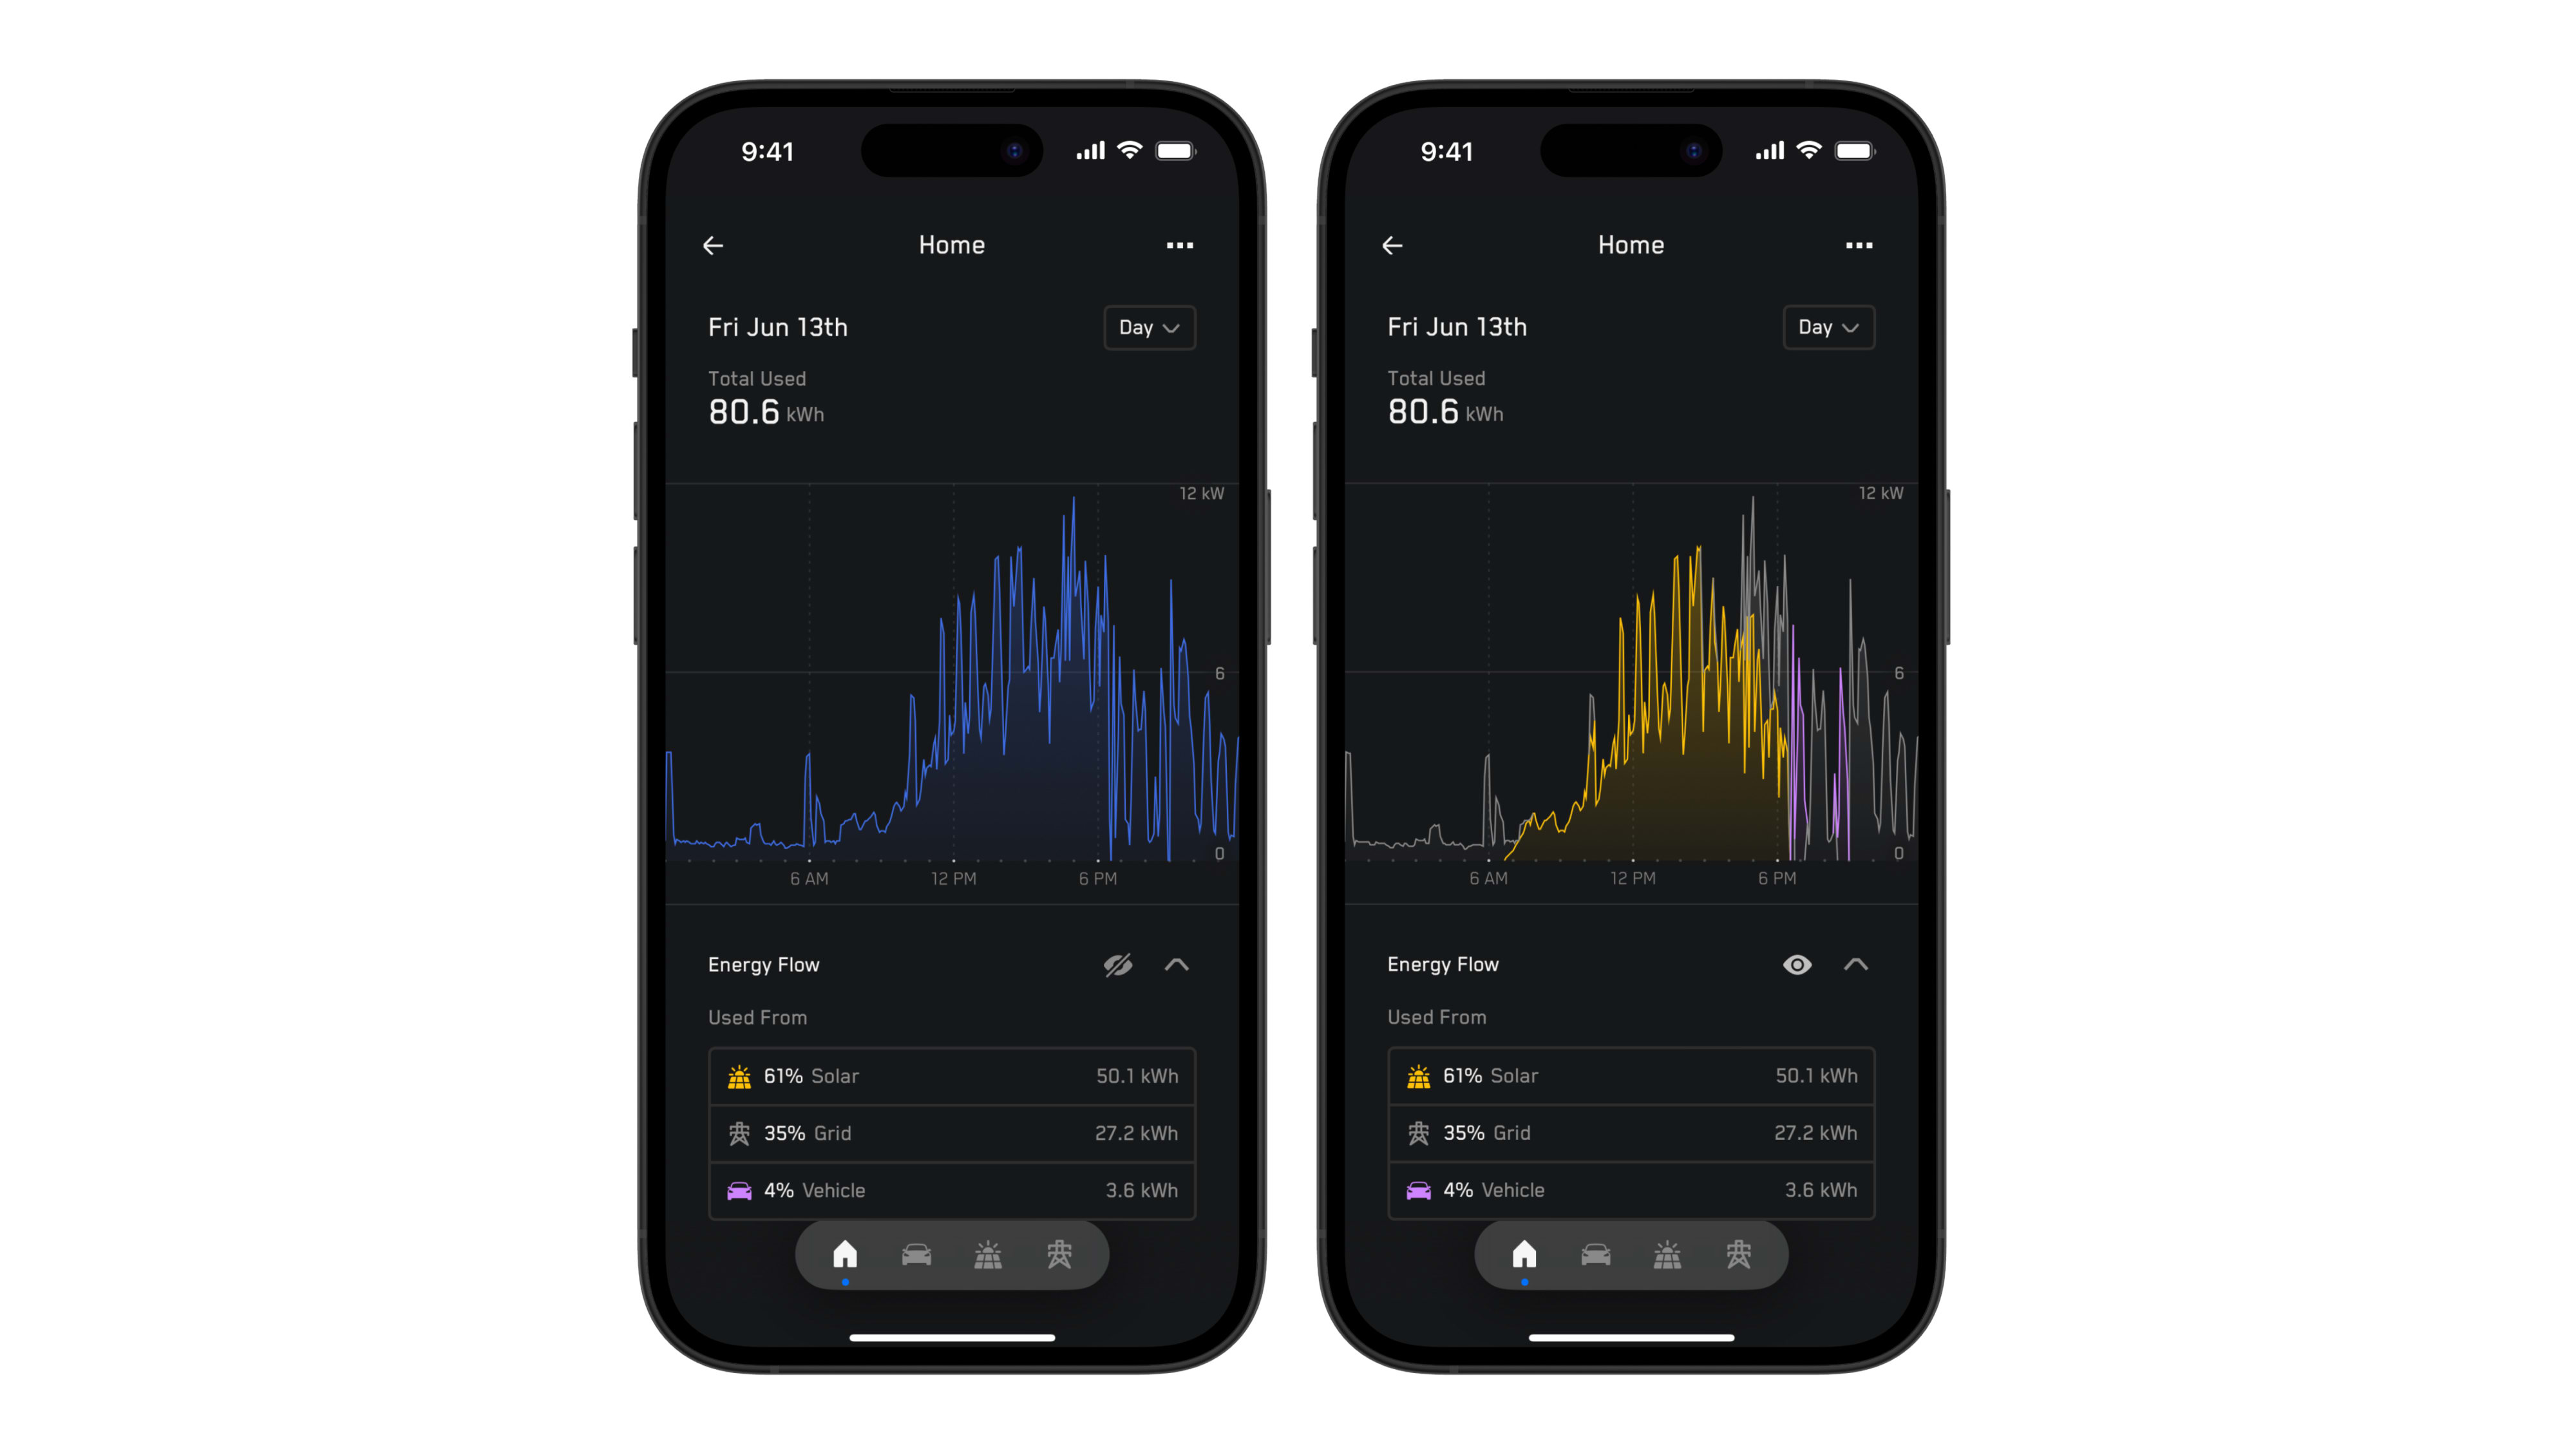
The Home graphs show your home energy usage. Energy Flow reveals the sources of your home’s energy use, from solar, vehicle and the grid. Home energy is displayed in blue on graphs.
Vehicle
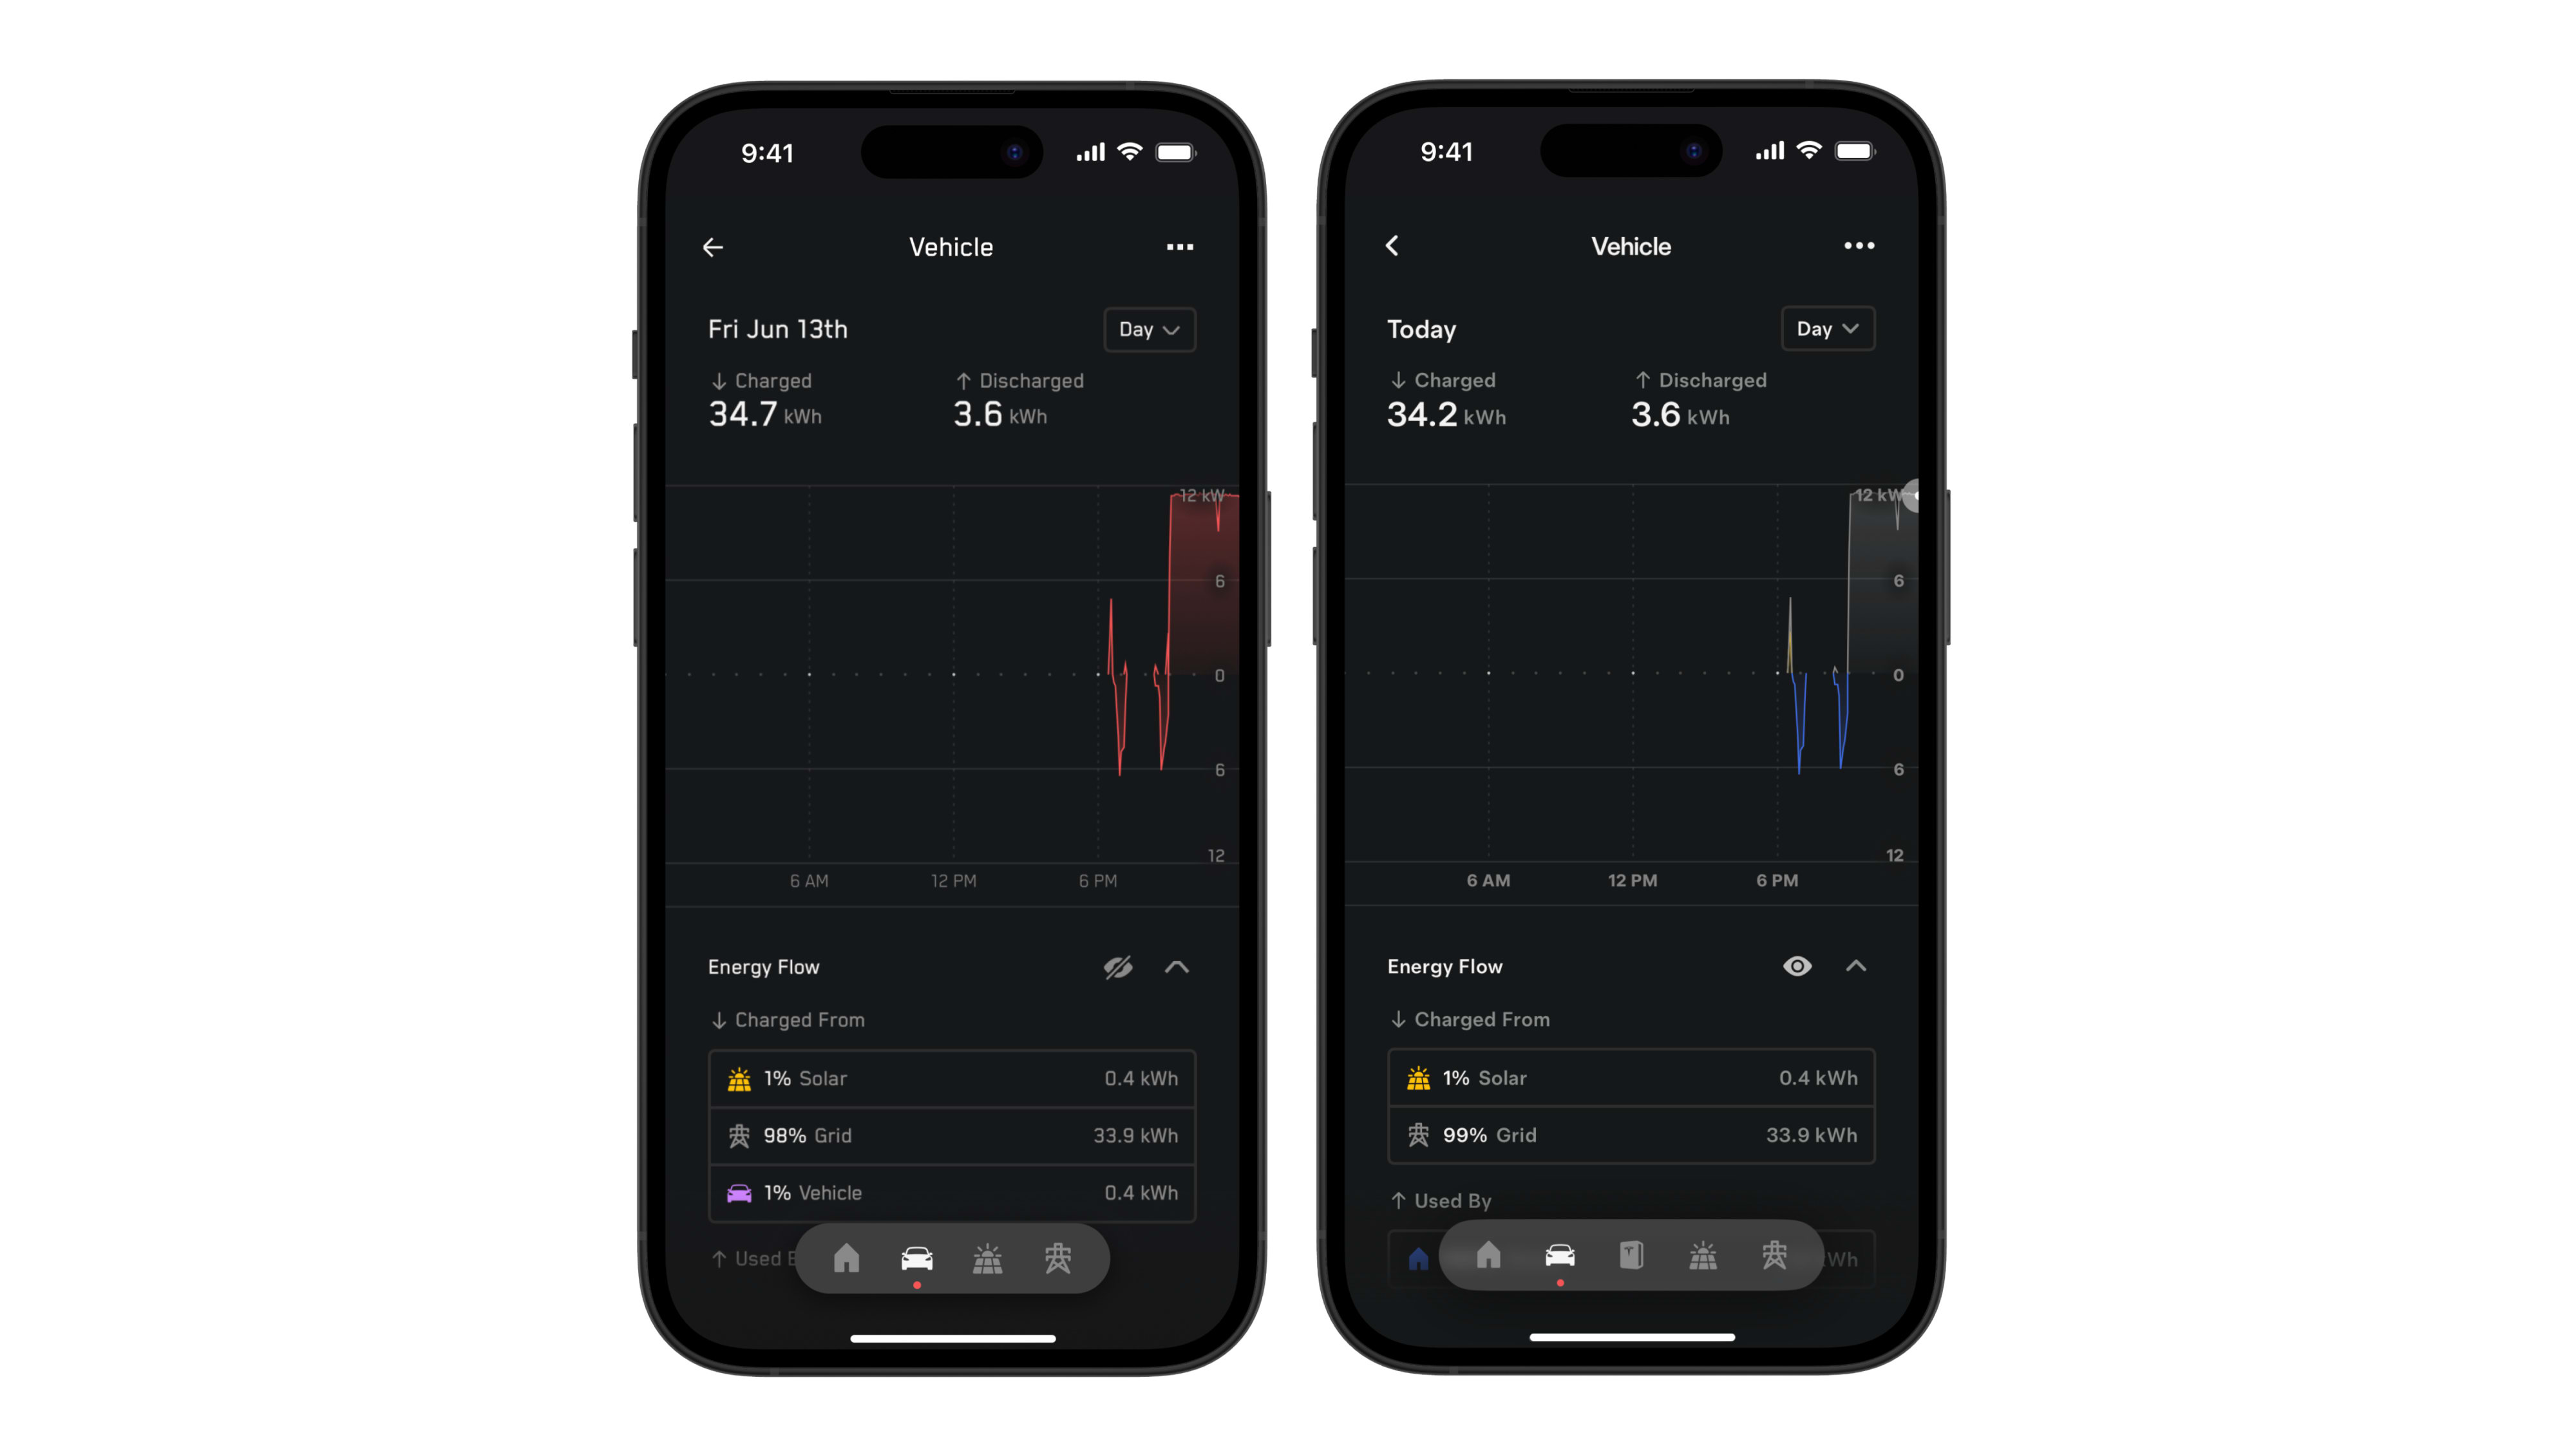
The Vehicle graphs show your vehicle with Powershare charging from solar, the grid or your vehicle discharging to your home. Vehicle data is displayed in red on the graphs.
You can also use Charge Stats to review your vehicle’s charging history at all charging locations, like your home, work, Superchargers or other locations.
Solar
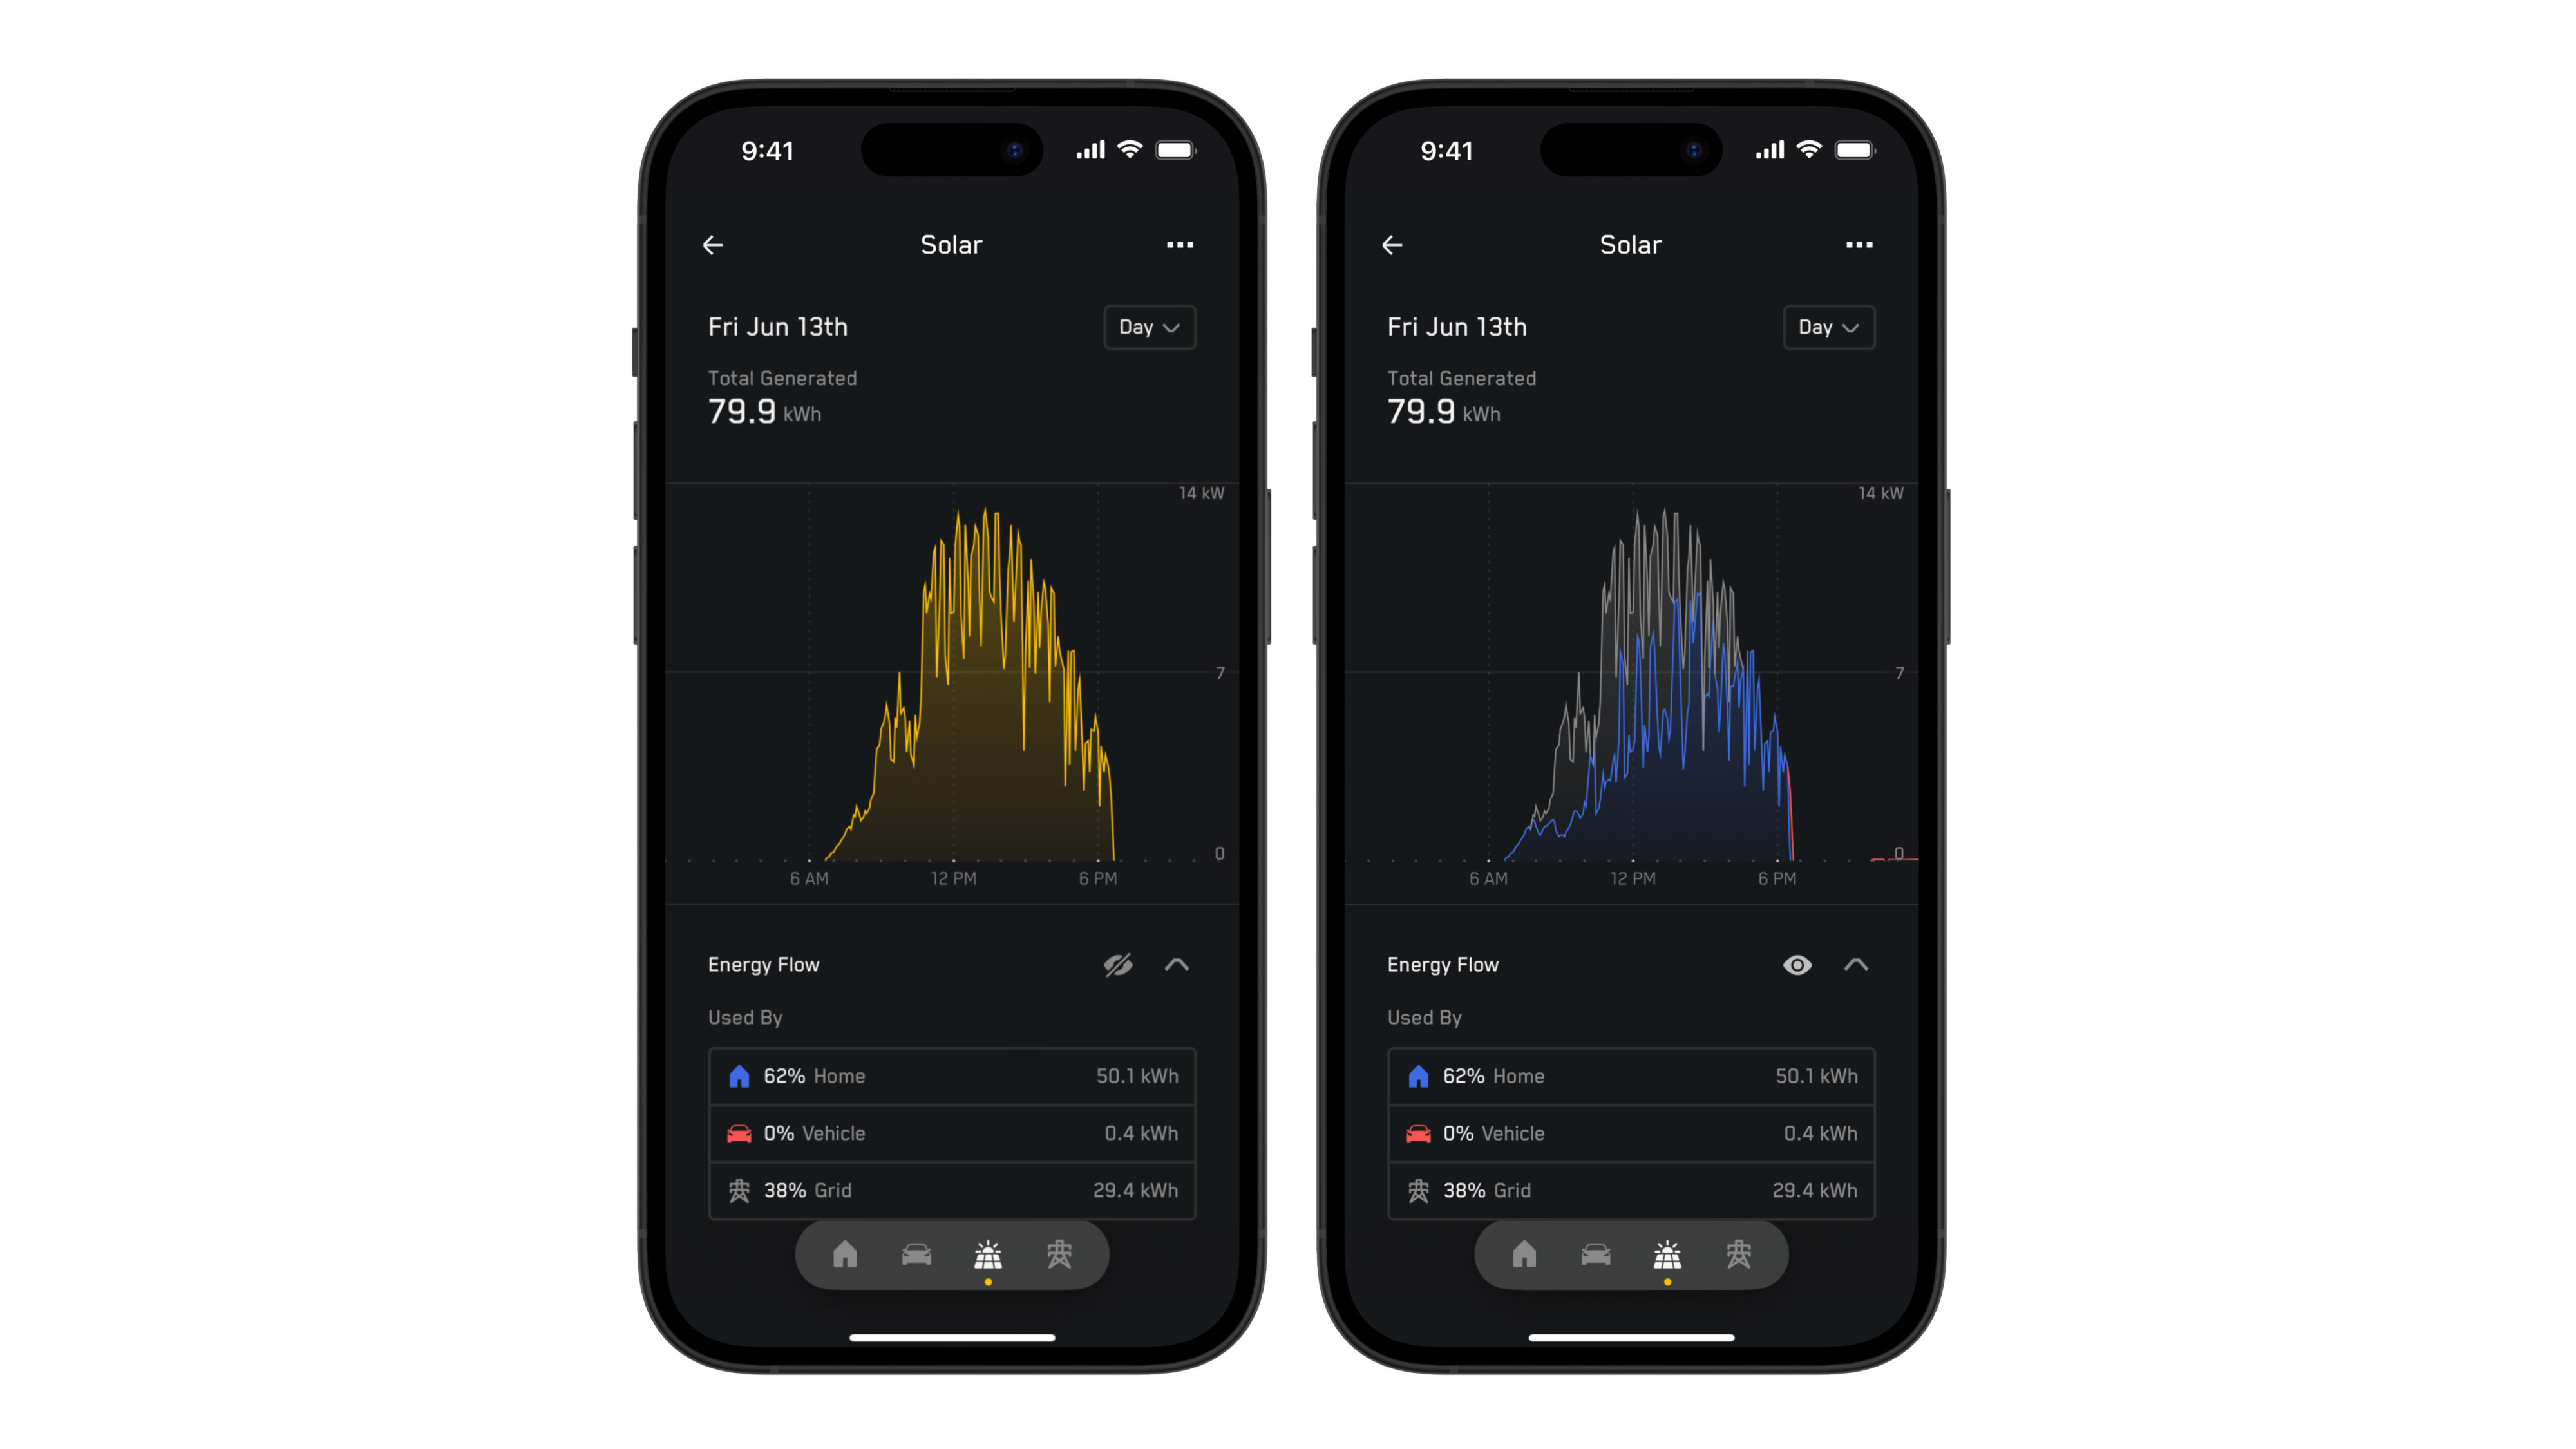
The Solar graphs show how much energy your solar produced and how much was used. Use Energy Flow to see where your system sends your solar energy. Destinations include your home, vehicle or the grid. Solar data is displayed in yellow on graphs.
Grid
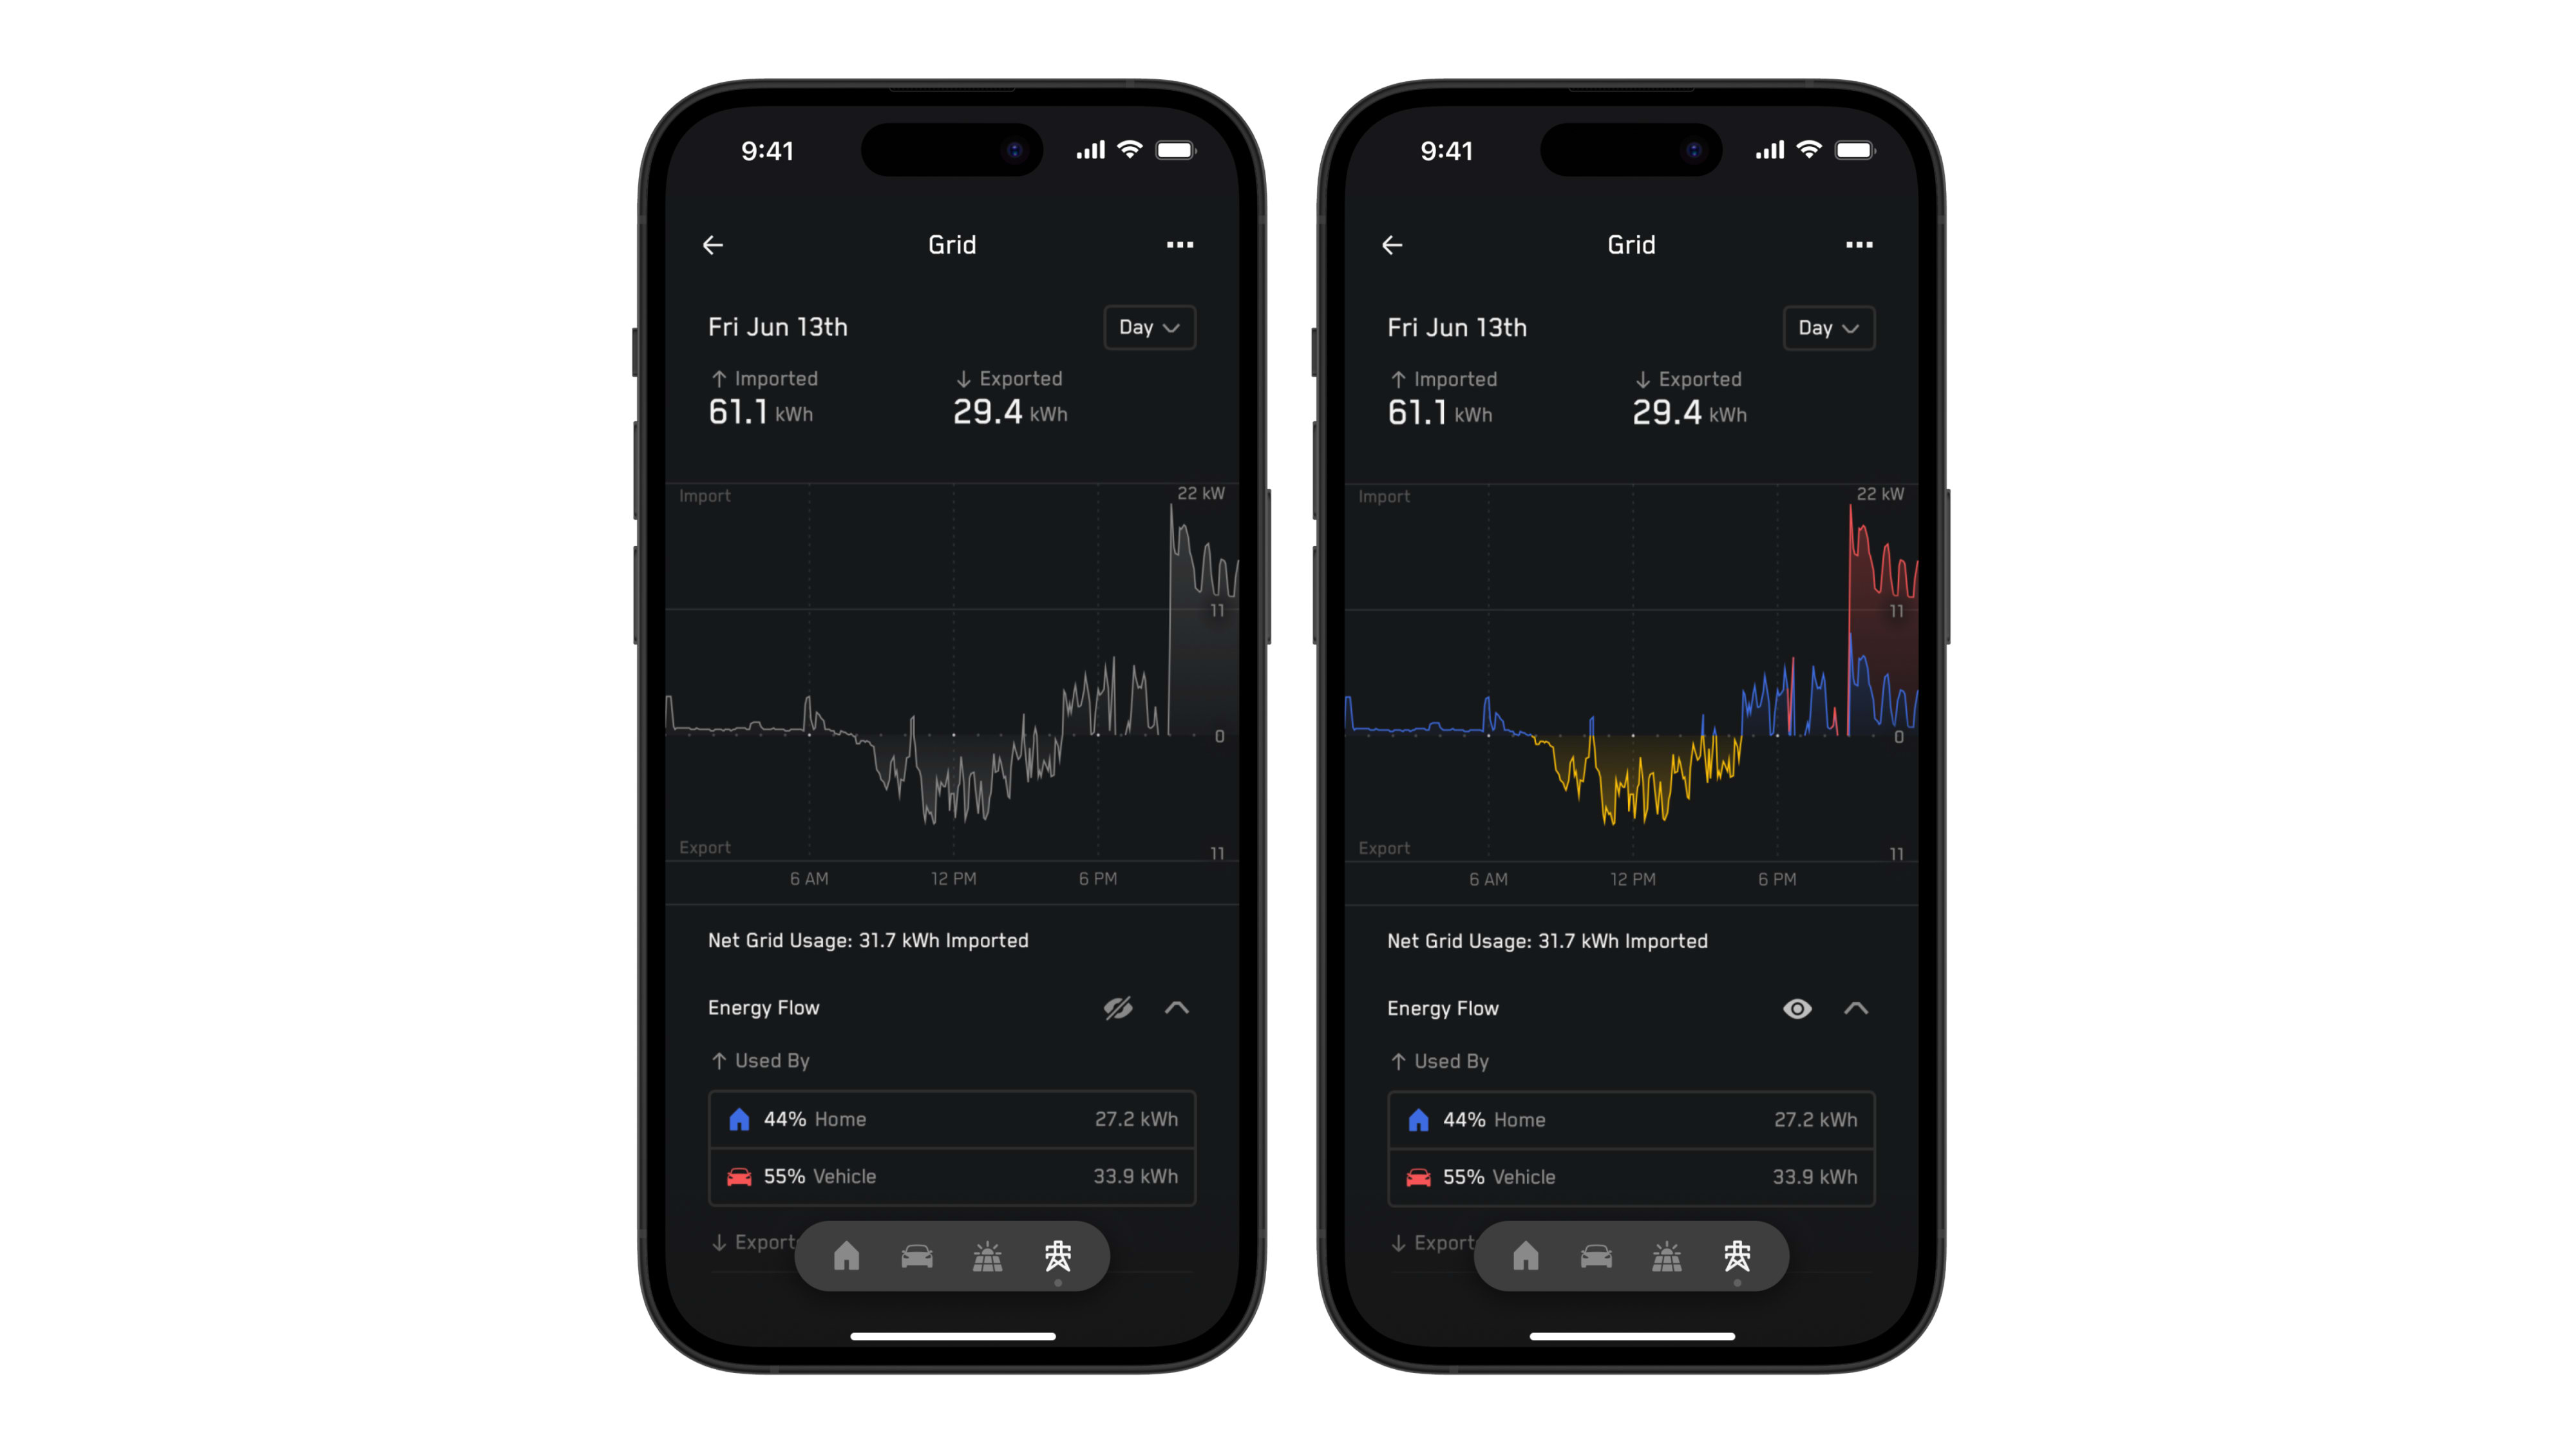
The Grid graphs show your system’s total energy imports and exports. Positive values on the graph show grid imports or usage, while negative values on the graph show grid exports. Grid data displays as gray on graphs.
You can download your energy data from the Tesla app by tapping the three dots in the top right of the graph screen > ‘Download My Data.’ Your data will export in CSV format. Data will be exported based on your current timescale (Day, Week, Month, Year or Lifetime) and selected time period. For systems with Powerwall installed, your charge level data is available in 15-minute intervals.
If a Wall Connector is registered for your home, you can view your EV charging history by tapping the three dots in the top right of the graph screen.
Why don’t I see solar broken out in my energy graphs, even though I have solar?
Metering, the ability to measure all the data, in the Tesla app has been available from July 2025. If you had your Powershare home backup system installed before then or are missing solar from the app, contact your Certified Installer.
Why doesn’t my total import and export match my energy bill?
Metering, the ability to measure all the data, in the Tesla app has been available from July 2025. If, for example, your Powershare home backup system does not back up all loads in your home, export and import values to and from the grid will not match your meter readings. If you suspect the values are incorrect, contact your Certified Installer.
What are the minimum software requirements for full energy data experience in the Tesla app?
To see your Powershare energy data graphs in the Tesla app, you need:
- Powershare Gateway with software version 25.18.3 or later
- Tesla app version 4.45.0 or later
- Powershare-enabled vehicle with software version 2024.44 or later