Energy Data
The Tesla app provides rich insight into your home's energy usage, solar generation and Powerwall charging behavior. The energy graphs will help you understand energy data over time and maximize the benefits of your renewable energy at home.
Note: The following explains the functionality of graphs from Tesla app version 4.23.2.
How to Use Energy Graphs
Energy graphs are categorized by components of your energy system, with each graph displaying a key part of your home’s energy use and generation. For example, the Solar component shows your home’s overall solar production. To access your energy graphs, follow these steps:
- Open the Tesla app and switch to your energy site.
- Tap ‘Energy.’
- Tap the icon for the component that you would like to view with the bar at the bottom of the screen.
The size of the graph data is relative to the amount of energy generated or consumed and not to the component you are viewing. For example, data for solar produced on a rainy day may be smaller than data for large amounts of excess solar that was exported to the grid. A kW will have the same visual height across all components, and the graph axis will rebalance as you swipe between days. You can also access a simplified view of the overall impact your energy system has had on your home over longer periods of time.
Note: Some solar systems may not have a site meter to show home and grid usage. If your system does not have components available in graphs, learn more about monitoring your system for solar panels or Solar Roof. To access additional features and insights on the Tesla app, consider purchasing or leasing a solar system with Powerwall.
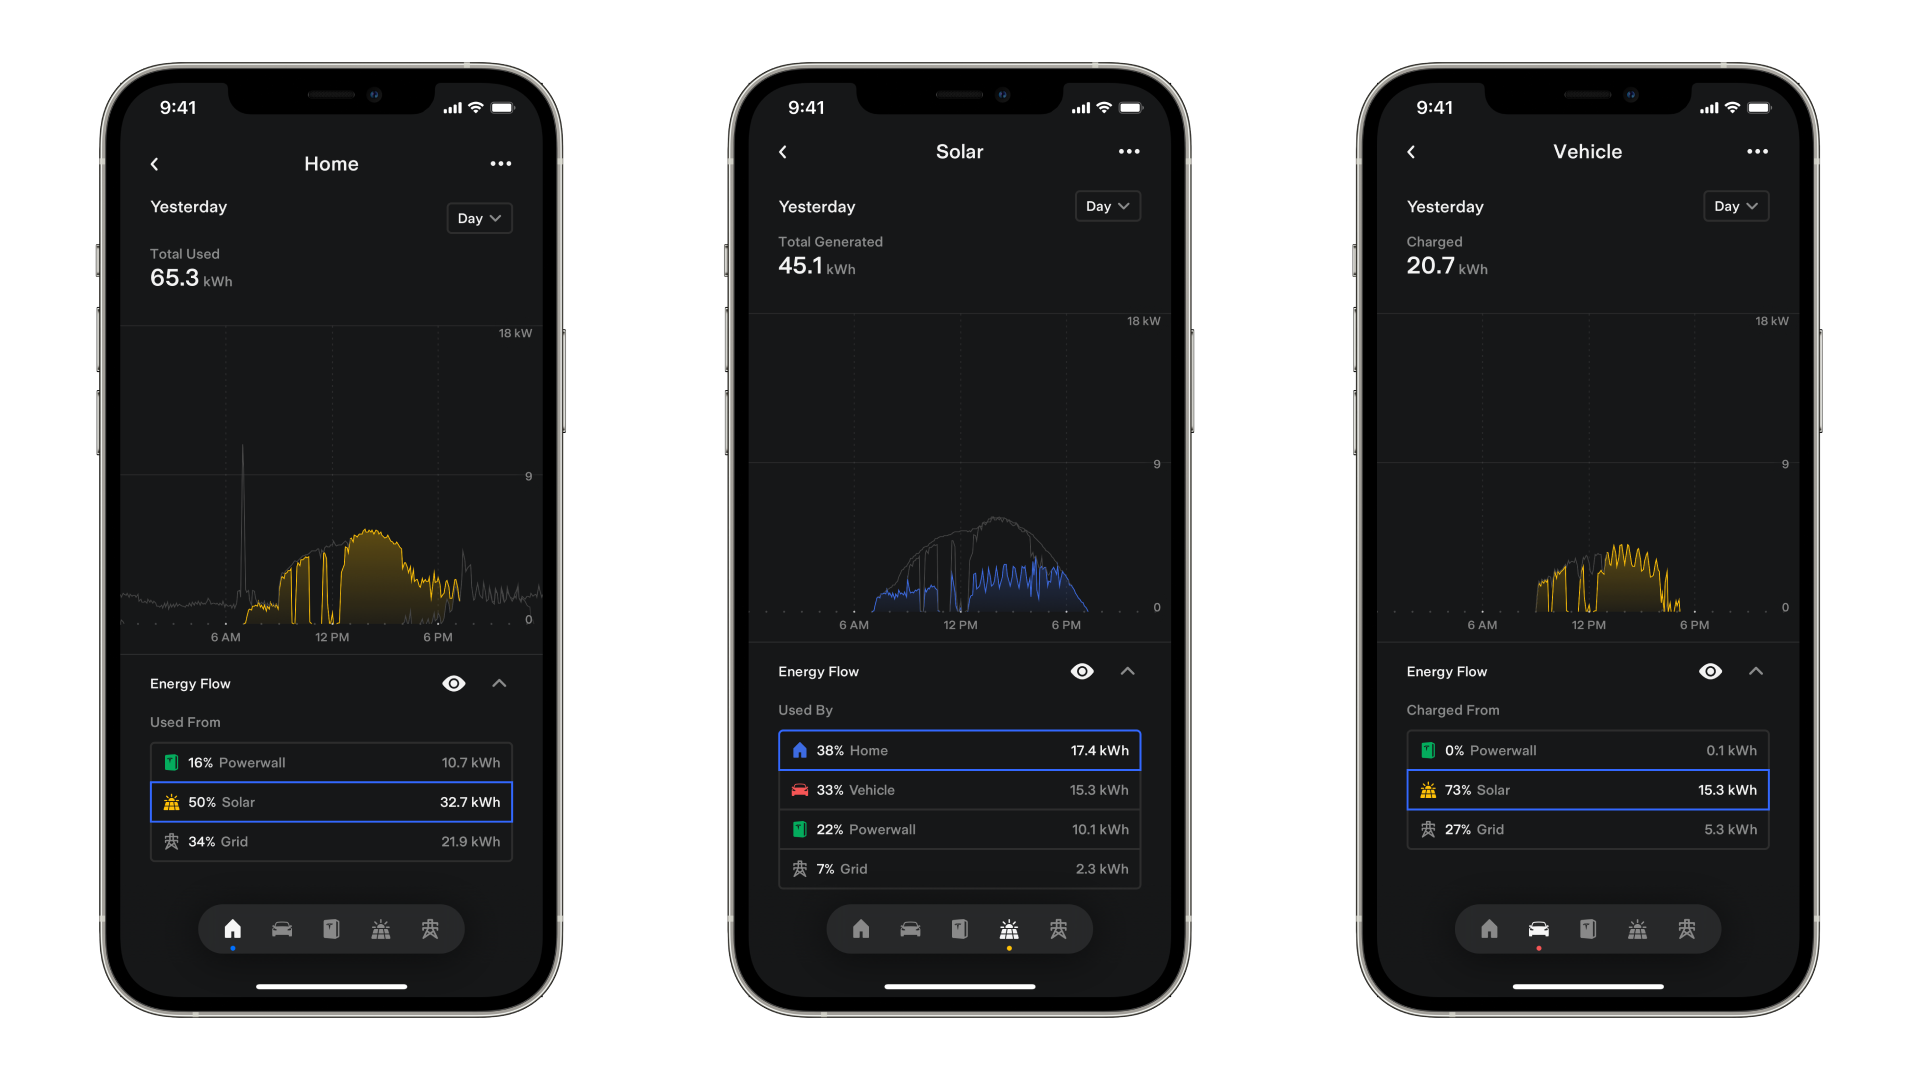
Energy Flow
The data in the energy flow section shows total imports and exports per component in percentage and kilowatt hours (kWh). You can tap an energy flow row to transform your graphs and better understand where each component is exporting energy to or using energy from. For example, your Powerwall exports energy to your home and can use energy from solar.
Enable Energy Flow for your graphs by tapping the eye icon to the right of Energy Flow near the bottom of the graph screen. The colors used in the graph match the colors of other components in your system. You can also use Energy Flow to focus on one component in the graph. For example, you can view how much solar energy your home exported to the grid by tapping ‘Solar’ under ‘Exported From’ while the Grid component is selected.
History & Timescales

The graphs let you review all your system’s historical data at any time, right at your fingertips.
You can view data by day, month, year or lifetime. Use the timescale selector on the top right corner — it defaults to Day — to switch between these views. On the Day view, the energy graph will display stacked area charts with timestamps of the power data. The Month, Year and Lifetime views use bar charts to visualize total energy.
Swipe sideways along the middle of the screen to go back and forth between time periods.
You can also access and review data from a specific day, month or year in the past. Open the timescale selector and tap ‘Choose Date.’ To return back to the most recent data available, open the timescale selector and tap ‘Go to Today.’
Scrubbing
Tap and hold on the graph view to scrub and review data from specific timestamps. For example, you can scrub and see that your solar generated a peak power of 6kW at noon, or that your home was using 3 kW of energy from solar production at the start of Peak with Savings mode.
If you have Energy Flow enabled, the scrubber shows the power values of each component at that timestamp, plus an aggregate total.
In the Powerwall component, the Charge Level graph will also display the charge level during each timestamp you scrub over.
System Components
Home
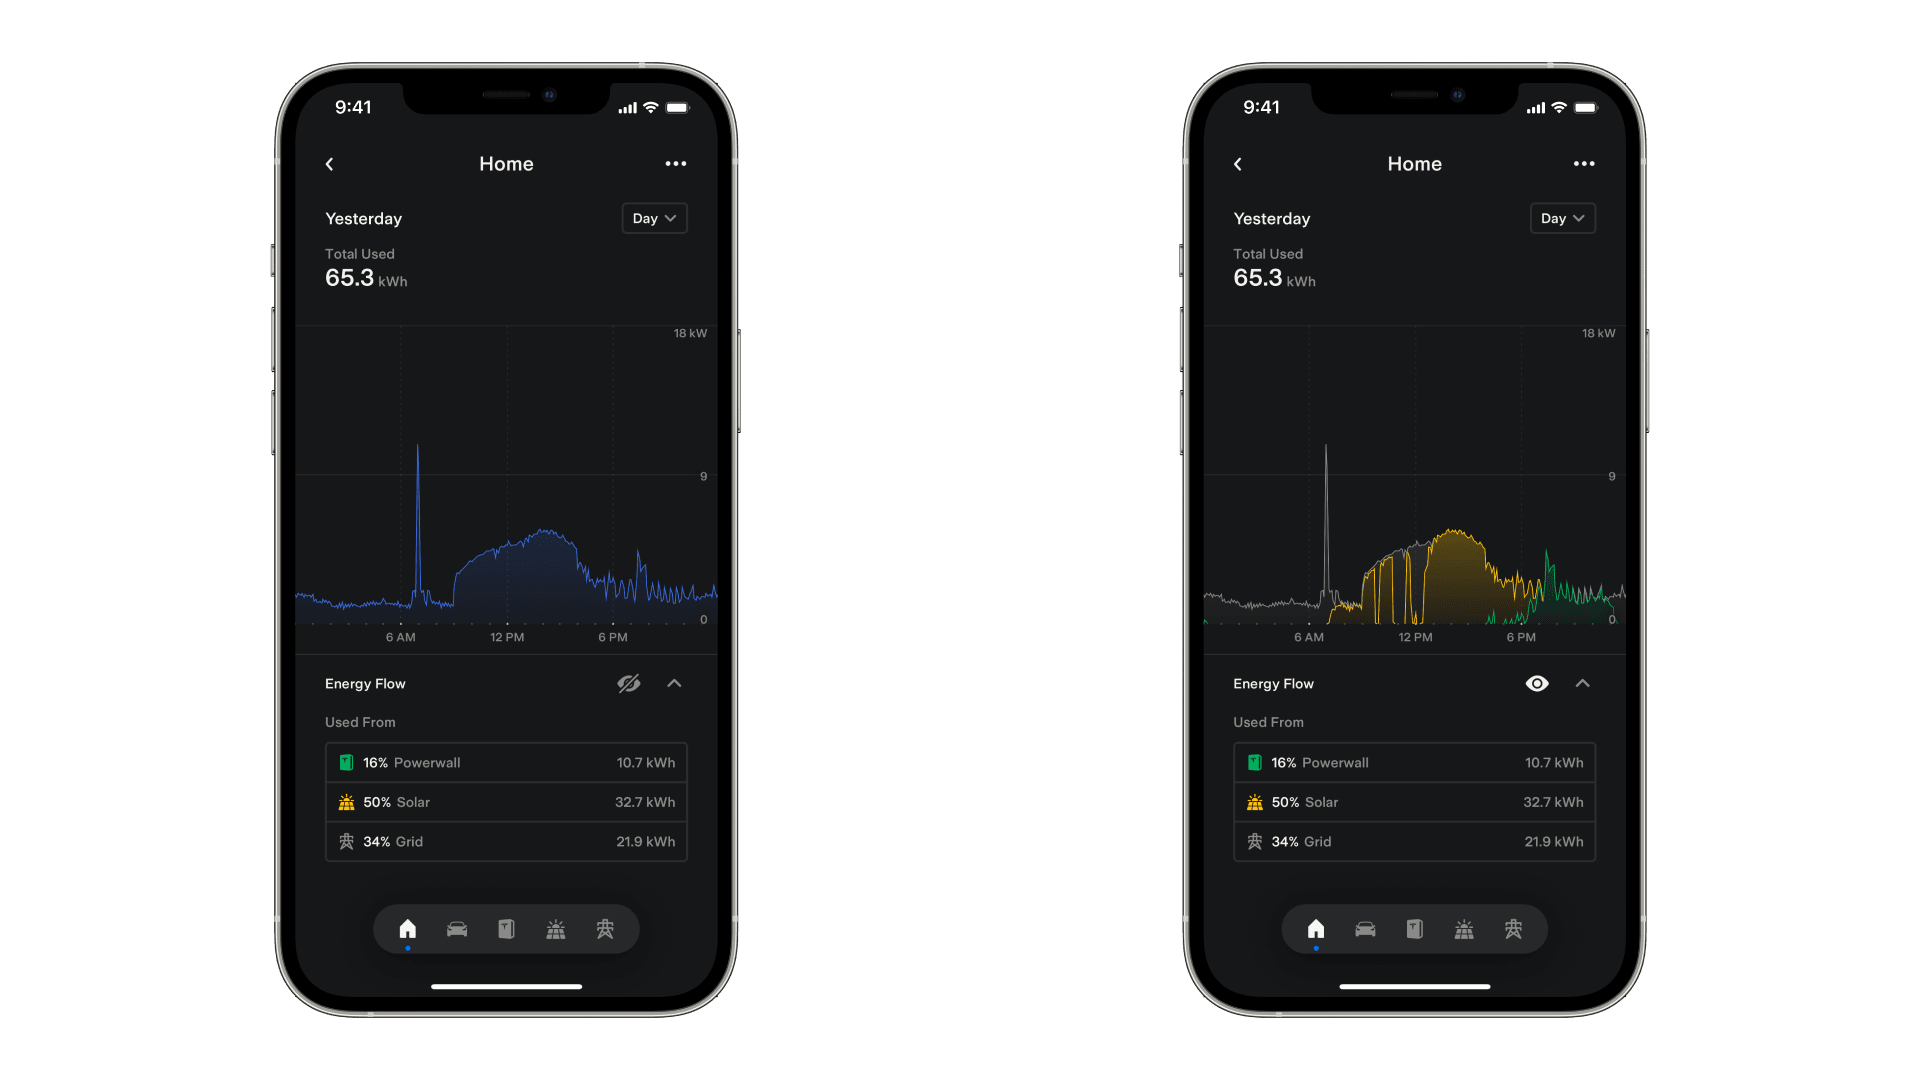
Your home is the center of your energy ecosystem. These graphs show your home energy usage. Energy Flow reveals your home’s sources of energy used from solar, Powerwall or the grid. Home energy displays in blue on graphs.
Vehicle

With Tesla app version 4.23.2, you can now see a component for your Tesla vehicle charging at home in the Tesla app. The graphs show your vehicle charging from Solar, the grid or Powerwall. Vehicle data displays in red on graphs.
In addition to vehicle graphs, Charge Stats is a great tool to review your vehicle’s charging history at all charging locations, like your home, work, Superchargers or other locations.
Note: Vehicle graphs are automatically available with Charge on Solar enabled. Vehicle graph data availability for users with Tesla Wall Connector or without Charge on Solar will be available later.
Powerwall
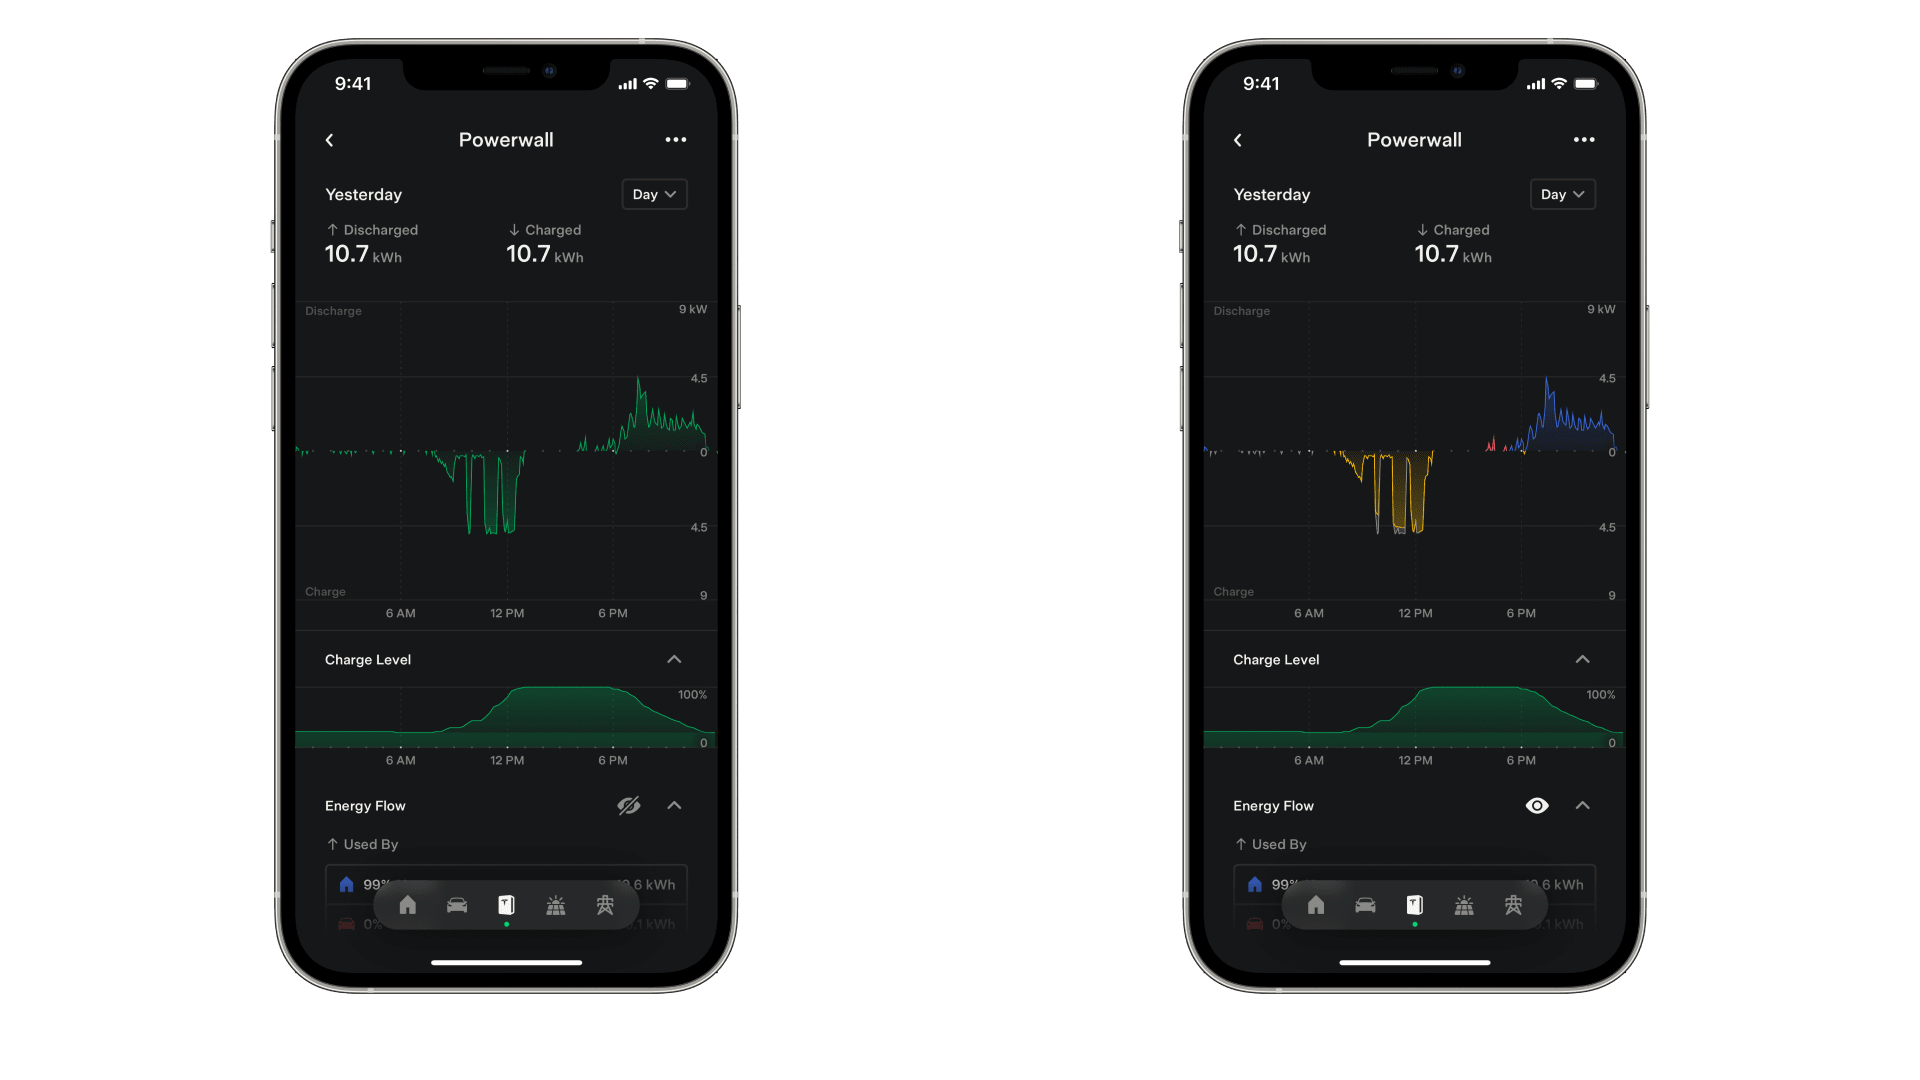
Your Powerwall provides energy storage, improves your home’s self-sufficiency and provides economic benefits while keeping your energy clean at any hour of the day. The values at the top of the screen show Powerwall’s charging and discharging. When your Powerwall is charging, the graph displays negative values. When your Powerwall is discharging to power your home or exporting energy to the grid, the graph will display positive values. Powerwall data displays in green on graphs.
The Charge Level graph shows your charge level and backup reserve percentage over time and always shows your current backup reserve.
Solar

Solar is the source of your system’s clean, renewable energy and reduces your dependence on the grid. Use Energy Flow to see where your solar energy was sent. Destinations include your home, vehicle, Powerwall or the grid. Solar data displays as yellow on graphs.
Grid

The grid data shows energy totals of imports and exports. Positive values on the graph show grid imports (or usage), while negative values on the graph show grid exports. Grid data displays as grey on graphs.
Download My Data
In the three dots menu in the top right of the graph screen, tap ‘Download My Data’ to export your system data in CSV format for further analysis. Data will be exported based on your current timescale (Day, Week, Month, Year or Lifetime) and selected time period (e.g., May, June, July, etc.). For systems with Powerwall installed, your charge level data is available at 15-minute intervals.
Charging History
If a Wall Connector is registered for your home, you can view your EV Charging History in the three dots menu in the top right of the graph screen.